 NestAffiliate
  NestScale Product Variants
 Revenue report gives you a clear view of your overall revenue performance generated while supporting customers.
There are 4 statistics you can track: Revenue, Conversation created, Conversion rate, and order created.
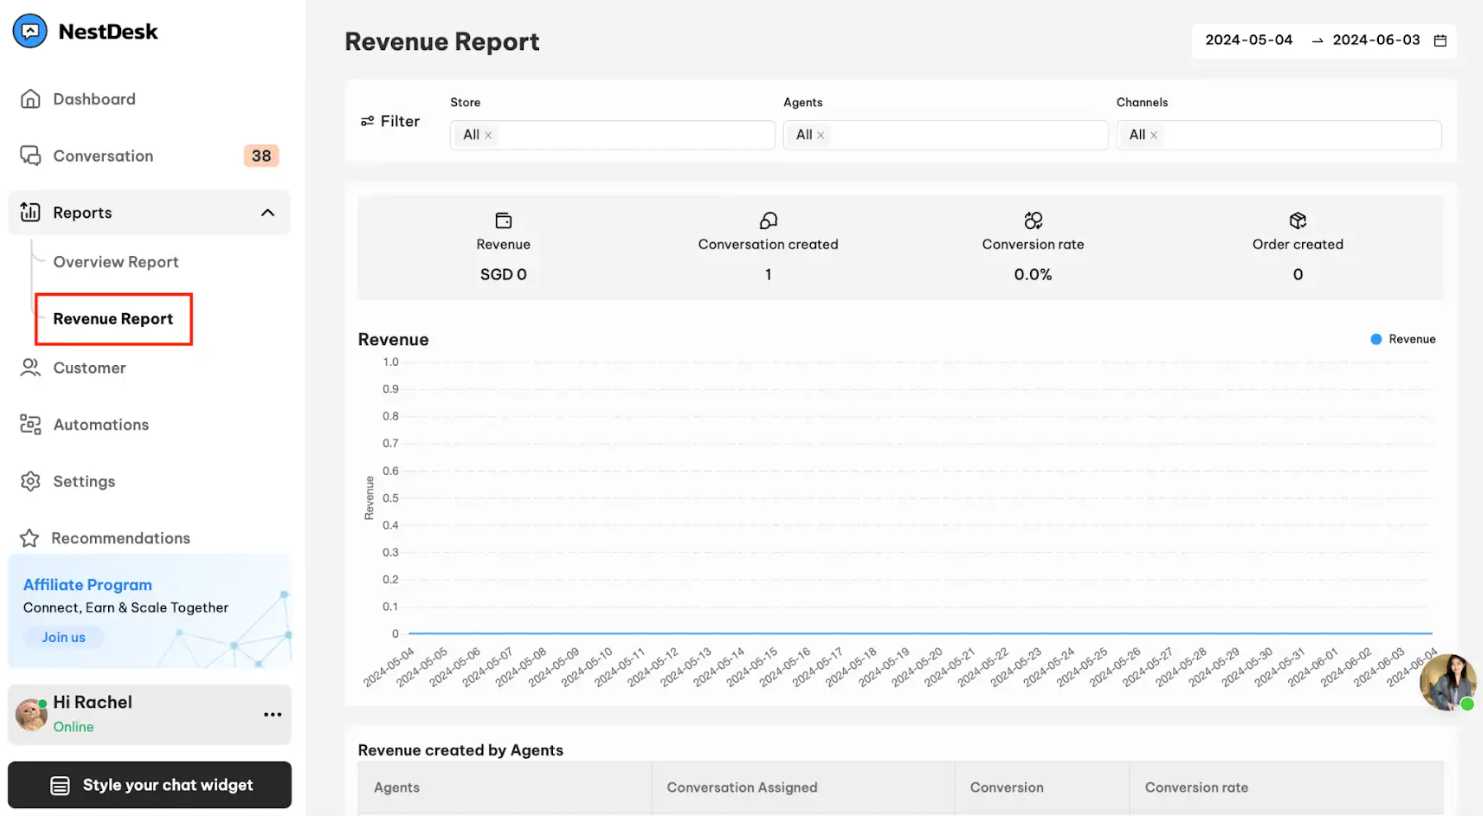
Key features of the Revenue report
- In the Revenue report, you can see the filter rows with 3 options: Stores, Agents, and Channels.
- The statistics of the Revenue report are Revenue, Conversation created, Conversion rate, and Order created.
- Revenue: The total money generated from selling your products.
- Conversation created: The number of new messages come from your channels.
- Conversion rate: Conversion rate is the number of customers who visit your stores that complete an order (a conversion) out of the total number of new customers.
- Order created: Only count paid orders and pending orders.
3. The statistic is shown in a line chart through 3 given periods of time: Day, Month, and Year.
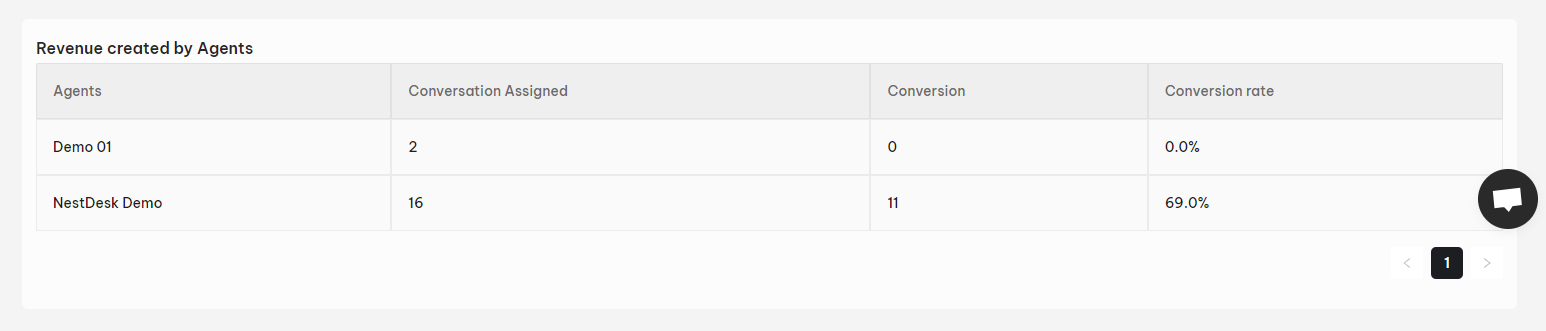
The statistics table of Revenue created by Agents
This table has 4 features: Agents, Conversation assigned, Conversion converted, and Conversion rate:
- Conversation assigned: The number of conversations assigned to an agent.
- Conversation converted: The number of conversations coming from your channels that turn into an order, out of the total number of conversations assigned by an agent.
- Conversion rate: The percentage of conversations that turn into an order, out of the total number of conversations assigned by an agent.
Interested in learning more about NestDesk? Book a demo with us!
Need any help?
Please contact our support team via live chat or email at [email protected]
We are happy to help you as soon as possible! 😊😊😊