 NestAffiliate
  NestDesk
  NestScale Product Variants
 In this post, you will learn about what Business Intelligence is and how it works. Let’s get started now!
*Note: Business Intelligence is only available in Pro plan.
What is Business Intelligence in NestAds?
Business Intelligence is the ultimate report for insights into your store’s performance and audience. It includes three main sections:
- E-commerce
- TikTok Ads Audience
- Cohort Analysis
Each section offers unique benefits to help you make informed decisions and improve your business strategies. By using the Business Intelligence report, you can get a clear view of your store’s performance, understand your audience better, and drive growth and success.
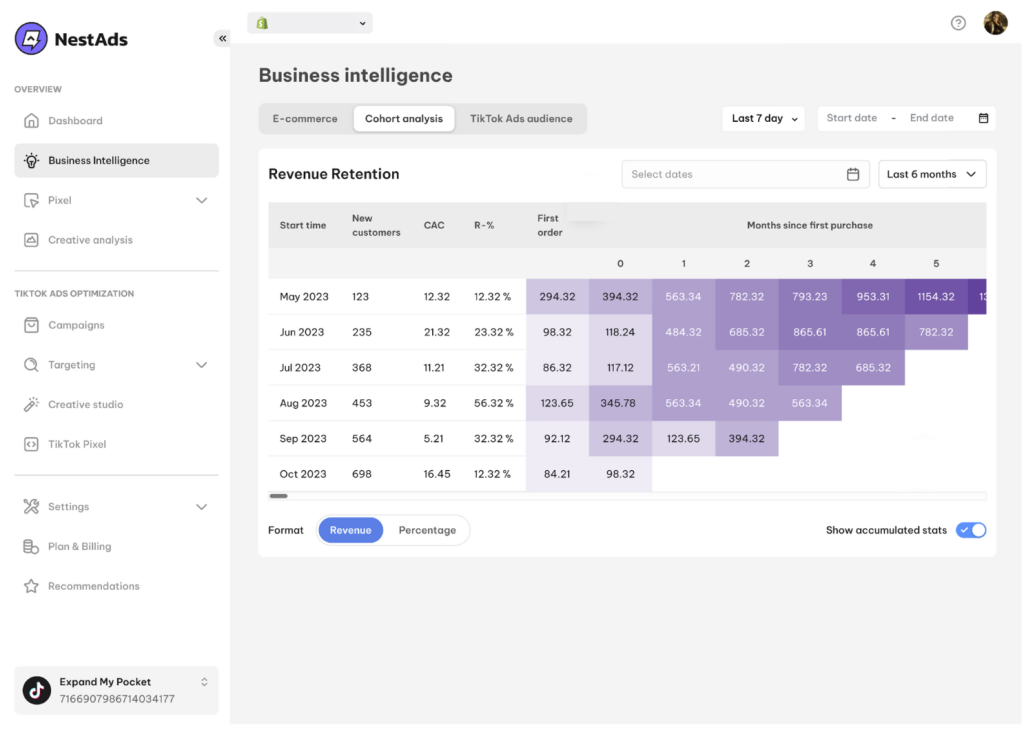
Cohort Analysis
Cohort analysis helps you analyze your customer behavior patterns and identify valuable customer groups for retention.
With cohort analysis, you can understand how much revenue a new customer will generate over time, and identify how long it takes until customer acquisition cost (CAC) is returned. Please note that the revenue will be synced from Shopify.
>>> Read more: Cohort Analysis
E-commerce
In the E-commerce report, you can view your store’s sales performance. You also have the option to adjust the time range to see data for specific periods.
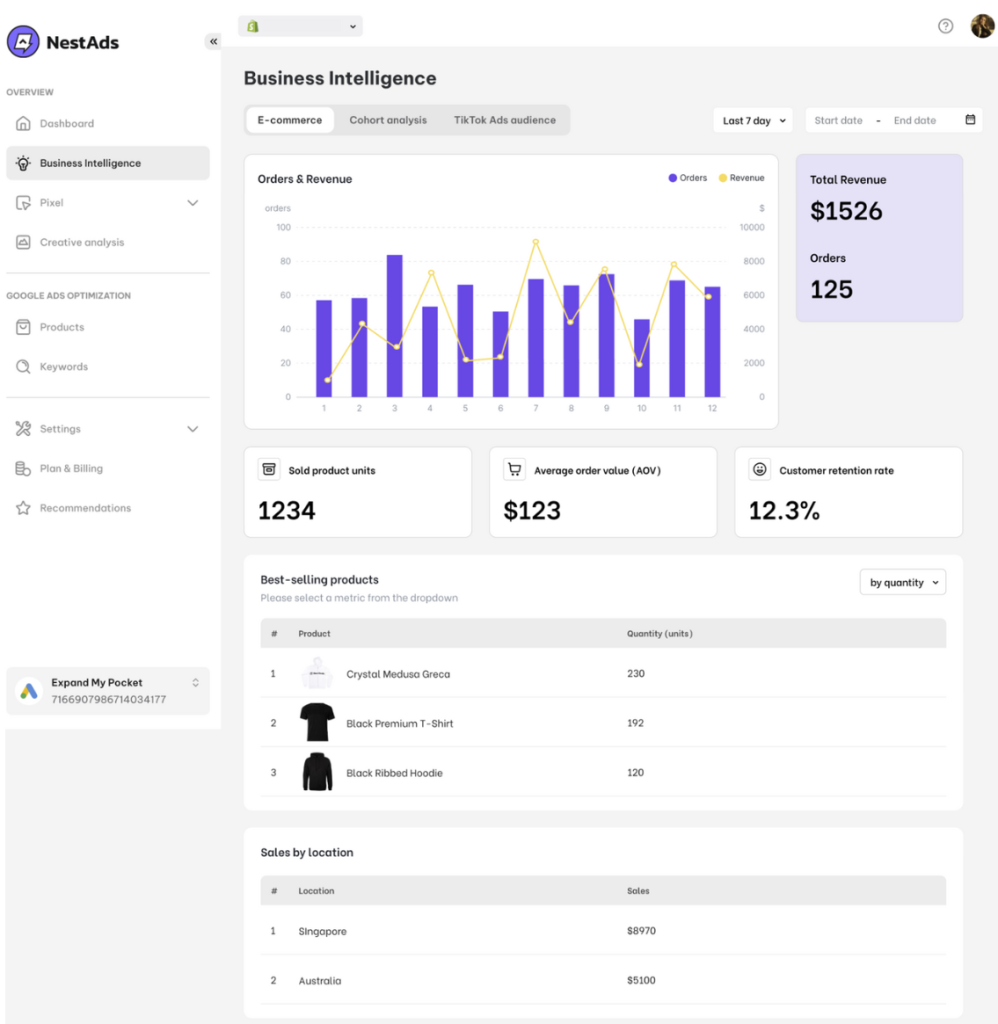
- E-commerce line chart: This chart shows the fluctuation and correlation between Revenue and Orders
- Revenue: Total amount of money you get from your orders
- Orders: Total number of orders you get
- Sold product units: Total number of products sold
- Average order value (AOV): Average price value of total orders
- Customer retention rate: The number of customers purchased/total customers in a given time
- Best-selling products table: Showcase your best-selling products by quantity and by sales
- Sales by location table: Categorize your sales volume by location
>>> Read more: E-Commerce Report
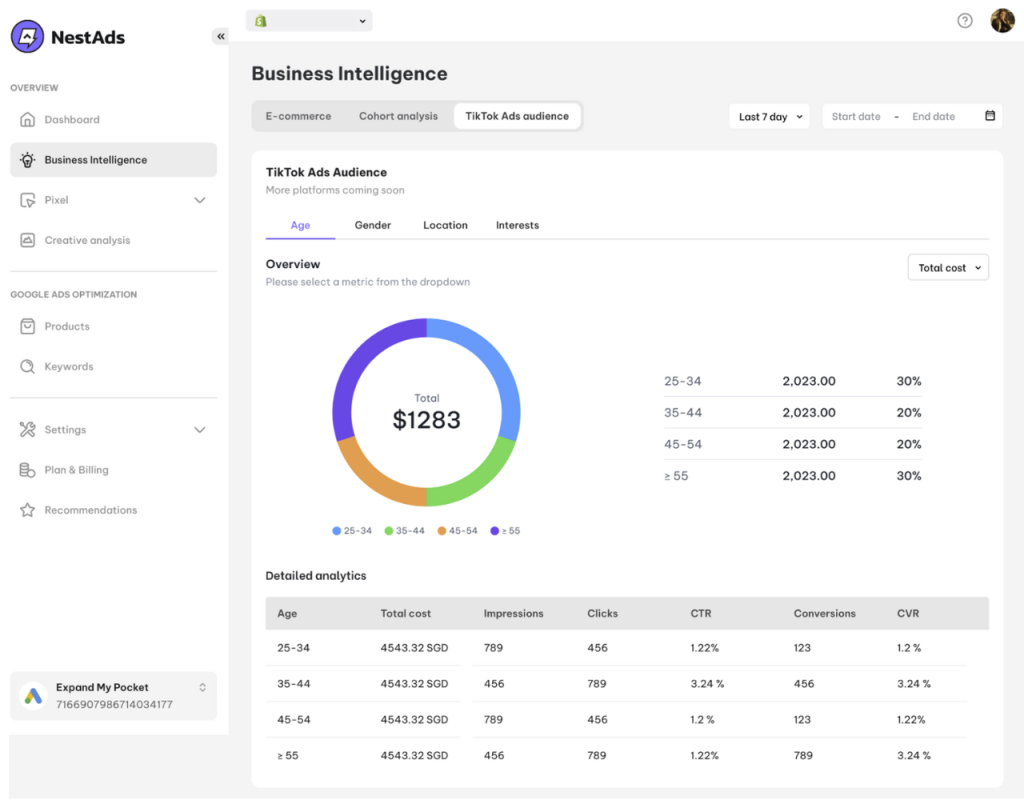
TikTok Ads audience
The TikTok Ads Audience report provides an in-depth view of your audience using key metrics.
Four main criteria (Age, Gender, Location, and Interests) are displayed in pie charts. For each category, you can track specific metrics by selecting options from the drop-down list.
In the Detailed Analytics table, you can see the complete breakdown of all metrics and their correlations:
- Total cost
- Impressions
- Click
- Conversions
- CTR
- CVR
>>> Read more: TikTok Ads Audience
Need any help?
If you need any help, feel free to contact us via live chat in app or email at [email protected]. Our support team is happy to assist.