 NestAffiliate
  NestDesk
  NestScale Product Variants
 Overview Of Creative Analysis
As its name suggests, Creative Analysis feature enables you to analyze creative performance for better optimization. In particular, you can use it for:
- Analyze creative performance from different platforms in one place.
- Evaluate the performance of individual ad creative and compare how it performs across campaigns.
- Compare ad creatives by specific metrics in various attribution conditions.
In this guide, you will learn how Creative Analysis works and how it can help advertisers optimize their creatives effectively. Let’s get started!
How to use Creative Analysis
Configuration
At the top of the Creative Analysis page, you’ll find the Configuration section, where you can filter creatives based on specific criteria.
Discover the details in the Configuration section below:
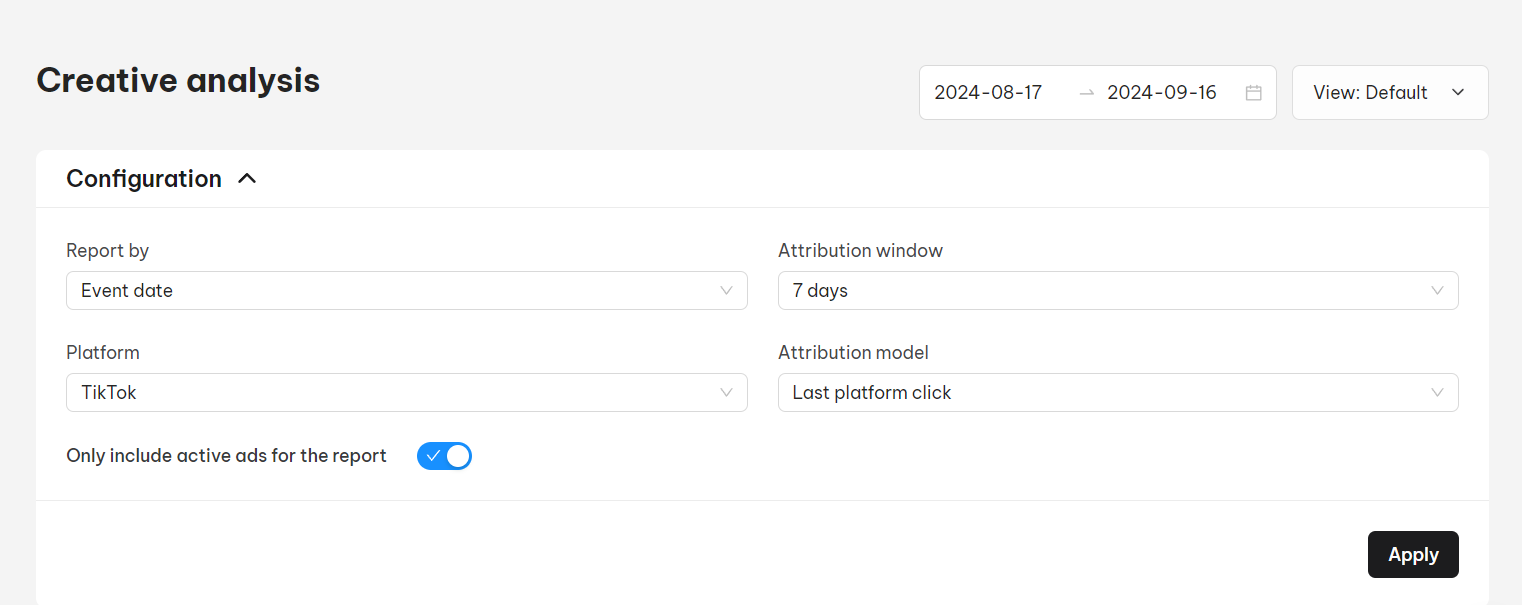
- Platform
Choose the creative source from your TikTok or Facebook ads library.
- Attribution Model
Attribution models determine how order values are attributed across touchpoints. NestAds offers the following attribution models:
- Last Platform Click: Attributes 100% of the order value to the last click on each platform.
- Last Click: Attributes 100% of the order value to the last click.
- First Click: Attributes 100% of the order value to the first click.
- Linear: Attributes the order value evenly among all clicks/touchpoints.
- Attribution Window
The attribution window is a defined period during which events are tracked and attributed to an ad. There are three attribution window options: 7 days, 14 days, and 30 days.
- Report Mode
Two report modes are available:
- Event Date (Order Date): Records revenue and attribution based on the day the order checkout is completed.
- Click Date: Records revenue and attribution based on the day the ad is clicked.
5. Only Include Active Ads for the Report
If enabled, only ad creatives with Active status will be displayed in the report.
After modifying these settings, the corresponding data updates will appear in the Creative Table report.
6. Date Picker
Select a specific time range to view creative data, with a maximum range of 90 days.
7. Saved View
This feature allows you to create multiple records with different configuration conditions for creatives.
If you don’t want to use the default view, you can create a new saved view. Customize the configuration section, charts, and creative table report as needed. Don’t forget to click Save All Changes in the current view after modifying.
You can also rename or delete saved views.
Creative Comparison Chart
The Creative Comparison Chart provides a clear view by comparing the trends of up to 4 creatives at specific time intervals using key metrics.
Note: The maximum number of creative comparison charts is 3.
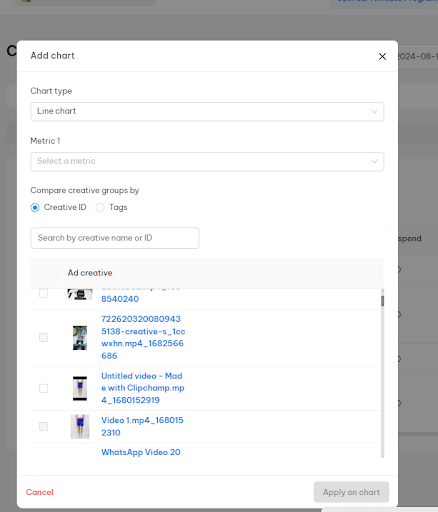
How to Create a Creative Comparison Chart:
- Click the Add Chart button.
- Customize the chart based on the following criteria:
- Chart Type: Select from Line chart or Column chart.
- Metric 1: Choose the primary metric of the creatives to be showcased in the chart.
- Metric 2 (optional): Choose to display a secondary metric.
- Creative Selection: Choose up to 4 creatives to compare. You can filter creatives by tag or ID for easier selection.
- Click the Apply on Chart button.
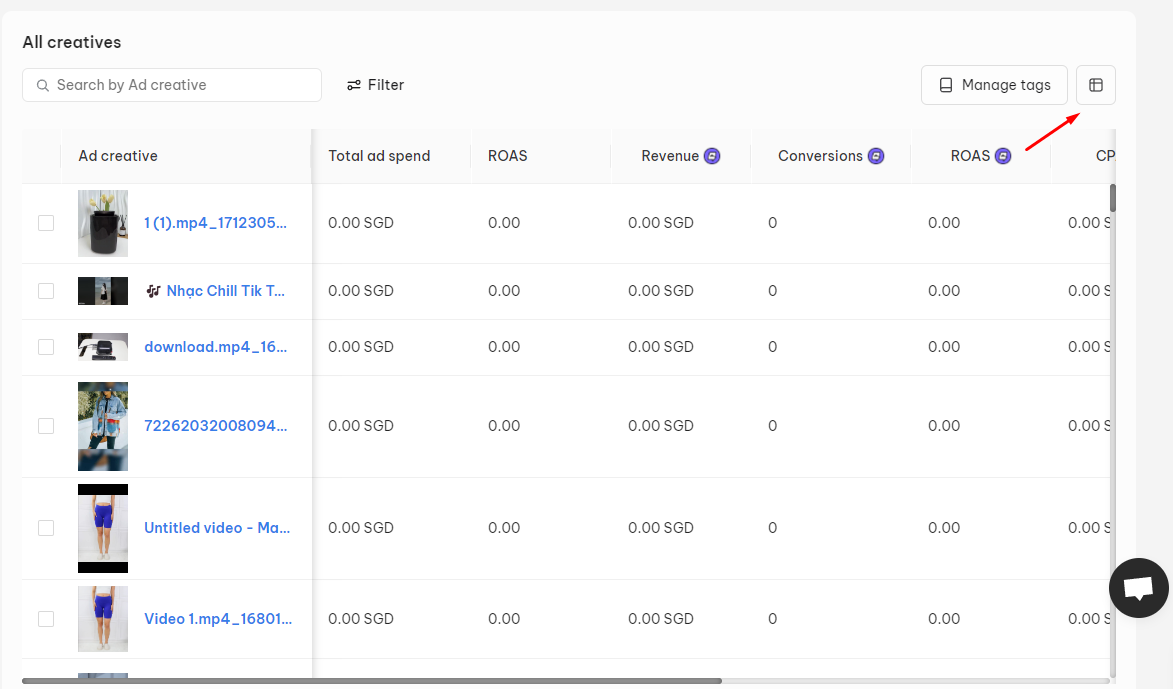
Creative Table Report
The Creative Table Report is your one-stop destination for detailed performance data of your ad creatives.
The data in this report will update based on the settings in the Configuration section at the top of the page.
View Creative Performance
Note: Only creatives with Impressions metric greater than 0 display in the Creative Table Report.
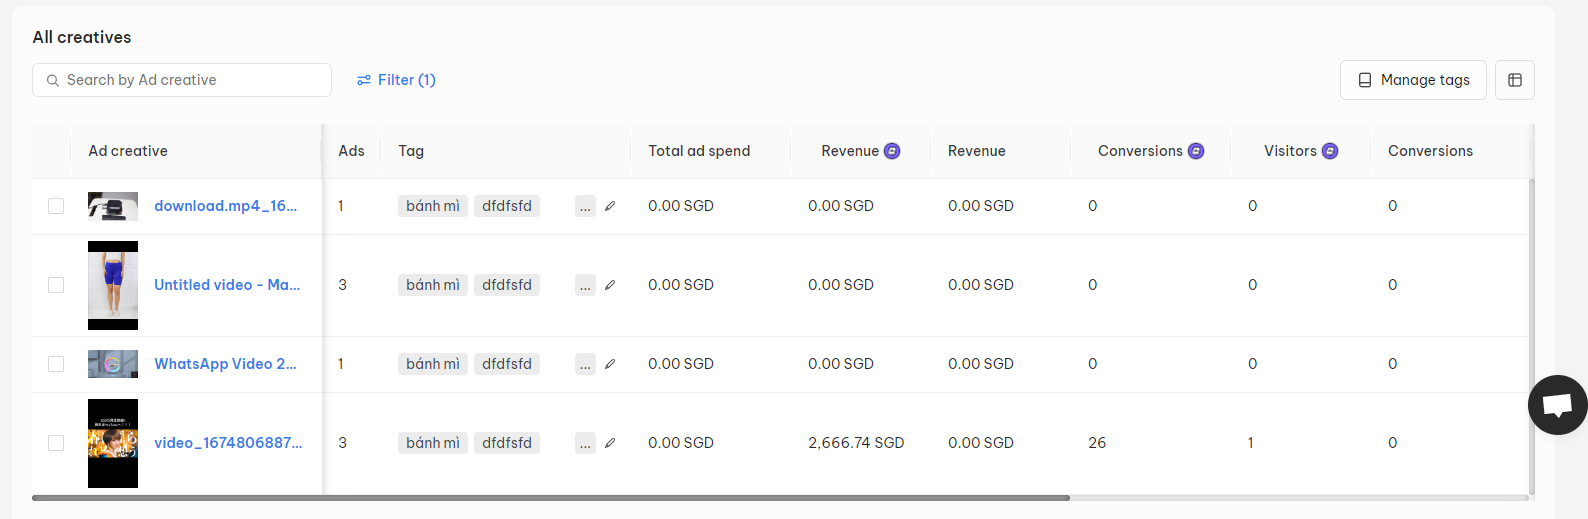
Breakdown of Information in the Creative Table Report:
- NestAds Metrics
Metrics with the NestAds logo are powered by the NestAds pixel (Server-side tracking pixel).
Depending on the selected attribution model, attribution window, report mode, and time range, the values of the following NestAds metrics may vary:
- Revenue: Total amount of money generated through conversions from your ads.
- Conversions: Total number of orders generated from your ads.
- ROAS: Return on Ad Spend, calculated as Revenue divided by Ad Spend. This indicates how much revenue you get back for every dollar spent on advertising.
- CPA: Cost per Action, indicating how much it costs to acquire a conversion through your ads.
- Visitors: Unique visitors who clicked on your ad and landed on your website.
- Conversion Rate (CVR): Percentage of visitors who converted after clicking your ad.
- In-Platform Metrics
In-platform metrics are powered by the in-platform pixel (Meta pixel or TikTok pixel). These metrics are tracked by the original advertising platform and its default attribution conditions. The values of these metrics may vary based on the selected time range.
- Revenue: Total amount of money generated through conversions from your ads.
- Conversions: Total number of orders generated from your ads.
- ROAS: Return on Ad Spend, calculated as Revenue divided by Ad Spend. Indicates how much revenue you get back for every dollar spent on advertising.
- CPA: Cost per Action, indicating how much it costs to acquire a conversion through your ads.
- Impressions: The number of times your ad was displayed.
- Clicks: Total number of clicks on your ad.
- CVR: Percentage of visitors who converted after clicking your ad.
- CPC: Cost per Click, indicating how much it costs for every click on your ad.
- CTR: Click-through Rate, the number of clicks your ad receives divided by the number of times your ad is shown.
- CPM: Cost per Mille, indicating how much it costs for every thousand times internet browsers load your ad.
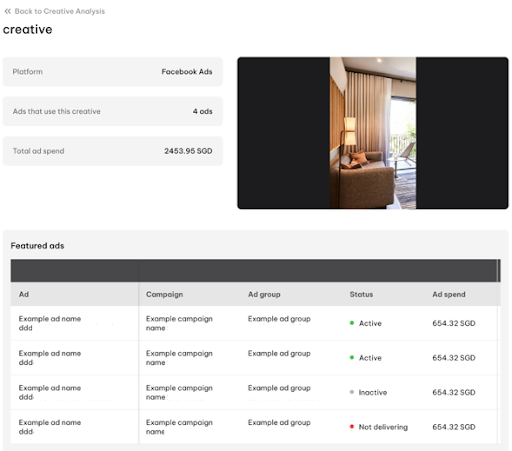
- Creative Details
To view the performance of a specific creative, click on it to open the detailed report. This report provides an in-depth view of a particular creative’s performance, including how many ads/ad sets it was used in and the total ad spend.
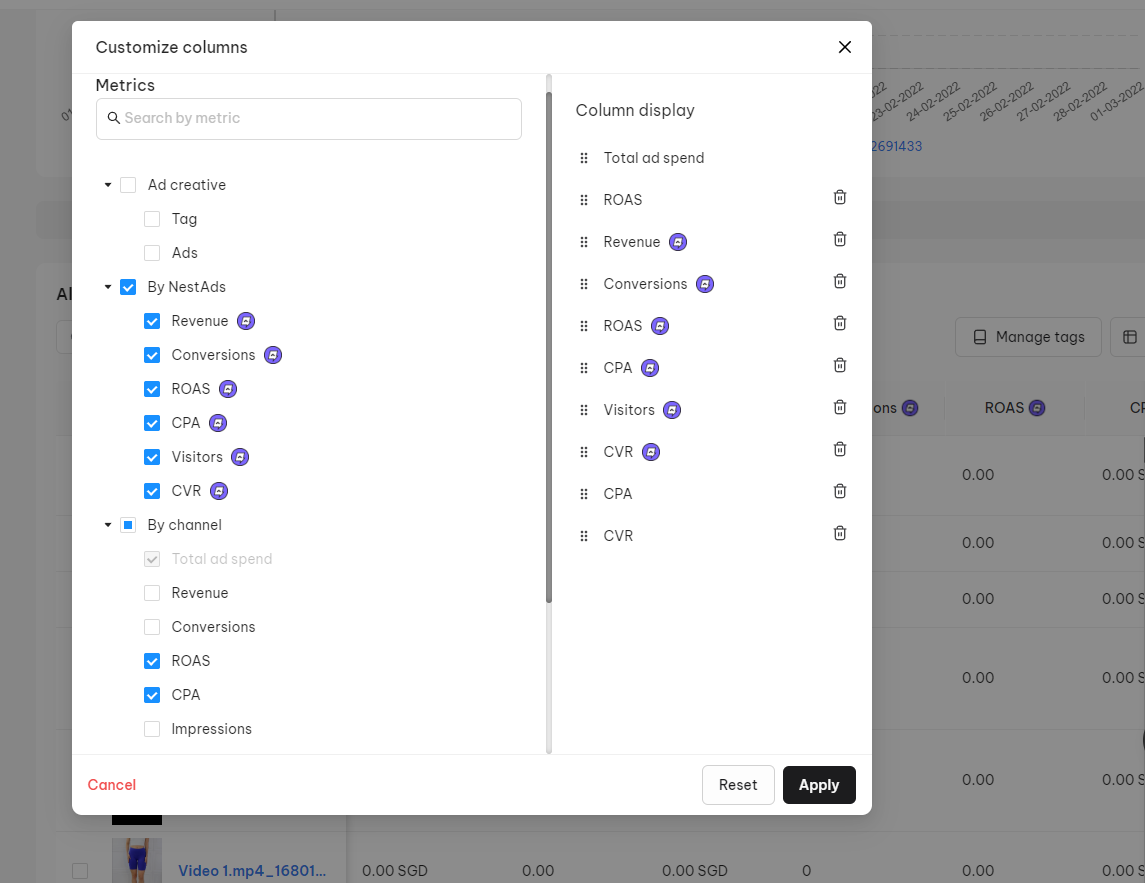
Customize Creative Table Report
To customize the Creative Table Report to match your needs, click the Customize icon in the top-right corner.
Here, you can select the metrics you want to display in the report. Drag and drop to arrange the position of each metric, then click the Apply button.
Create & Manage Tags
Tags help you organize and categorize creatives effectively in NestAds. You can create tags with or without rules.
To Create a Tag Without a Rule:
- Method 1: Select the creative you want to tag > Click Add Tags > Enter a new tag name > Click the Confirm button.
- Method 2: Click Manage Tags > In the Tag List tab, click Add Tags > Enter a new tag name > Click Save.
To Create a Tag With a Rule:
- Click Manage Tags > In the Tagging Rules tab, click Add Tagging Rule.
- Set up the conditions for your tag:
- Platform: Choose between Facebook or TikTok.
- Tagging Condition: Set one or multiple conditions for the tag.
- Condition Relationship: If you have more than one tagging condition, select the relationship between them (either “And” or “Or”).
- Tags: Enter a new tag name or select an existing tag.
- Click the Save button.
Once you save a tag with a rule, all creatives that meet that rule will be automatically tagged accordingly.
Filter Creatives
The filter feature helps you sort creatives by condition and quickly find your desired creative. In NestAds, you can filter creatives by Tags and Metrics.
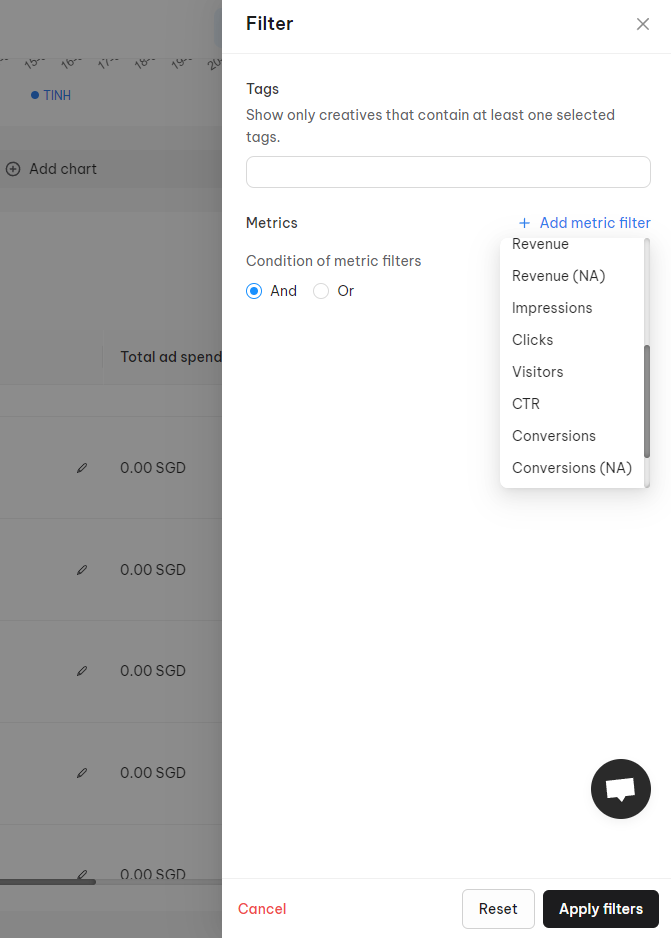
Filter by Tags
- Click Filter > Enter one or multiple tags > Click the Apply Filters button.
Filter by Metrics
- Click Filter > Click Add Metric Filter > Select one or multiple metrics > Set conditions > Click the Apply Filters button.
Note: You can combine both Filter by Tags and Filter by Metrics to sort out creatives.
Need any help?
Please contact our support team via live chat or email at [email protected]. We are happy to help you as soon as possible!