 NestAffiliate
  NestDesk
  NestScale Product Variants
 In this post, you will learn about NestAds Pixel performance report – How to understand and gain insights from it. Let’s get started now!
What is NestAds Pixel performance report?
NestAds Pixel performance report offers a comprehensive view of your marketing attribution. By syncing all marketing channels in one place, it allows you to quickly identify which channels are performing well and contributing to your bottom line.
To access the performance report in the NestAds app, navigate to the Attribution category. Click on Performance Report.
The performance report gives you an overview of the performance of your advertising channels and non-paid sources, which you can compare to one another.
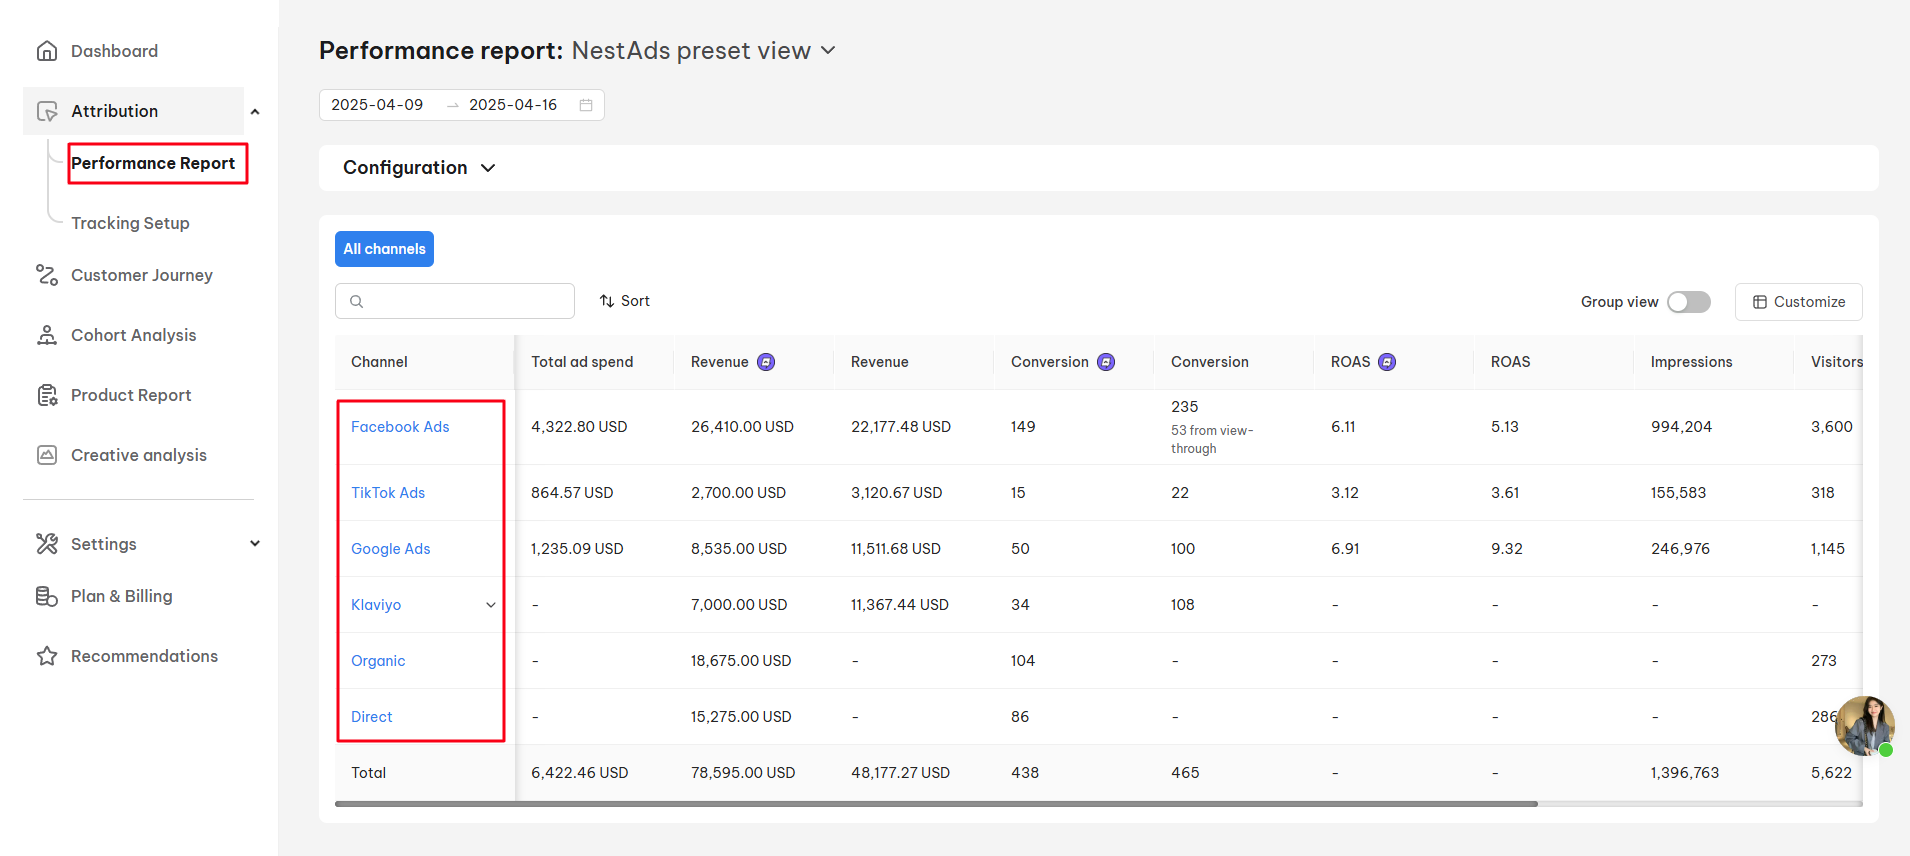
Note: You can only view the NestAds data report (columns with logos) after adding UTM parameter tracking to your ads.
>> Read more:
How to add NestAds tracking parameter in your marketing channels (Facebook Ads, Google Ads, TikTok ads, Klaviyo)
The Structure of NestAds Pixel Performance Report
NestAds performance report includes 2 main sources: paid channels and non-paid channels.
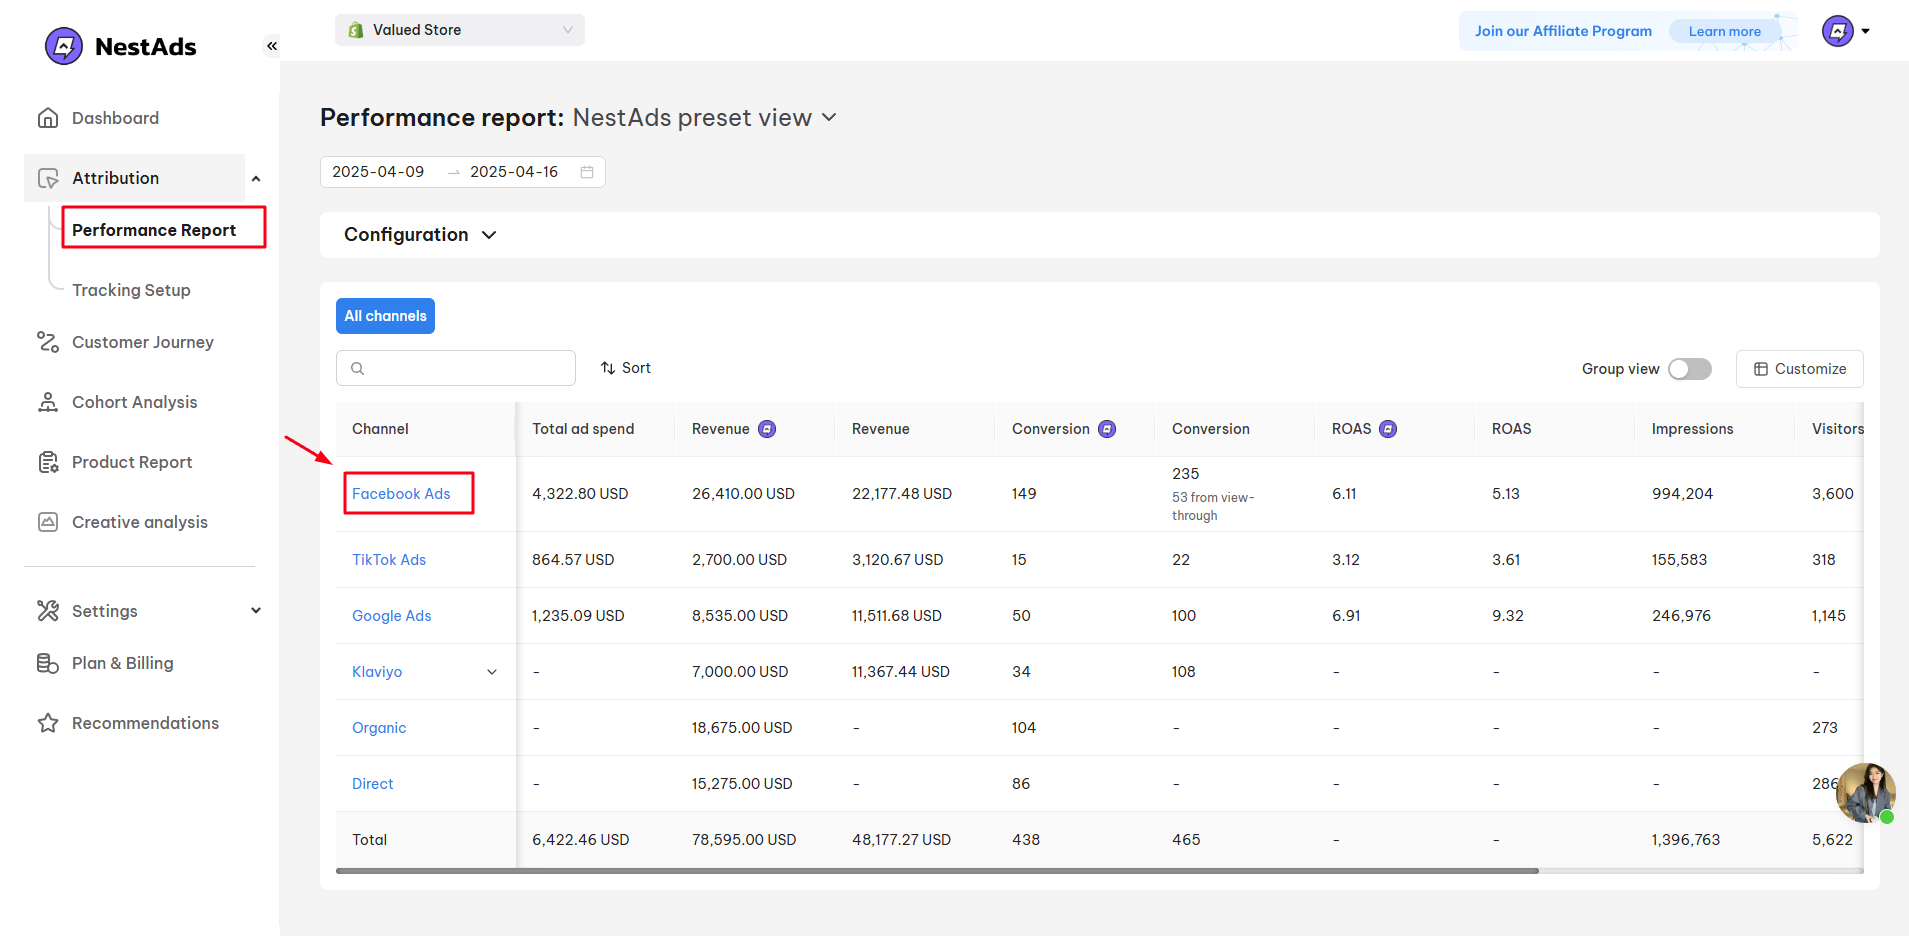
Paid sources report
Paid sources report includes all paid ad channels (TikTok Ads, Facebook Ads, Google Ads).
For example, if you click on Facebook Ads platform, you can see the report of all your Facebook ad campaigns.
Here is how Facebook report displays all the campaigns:
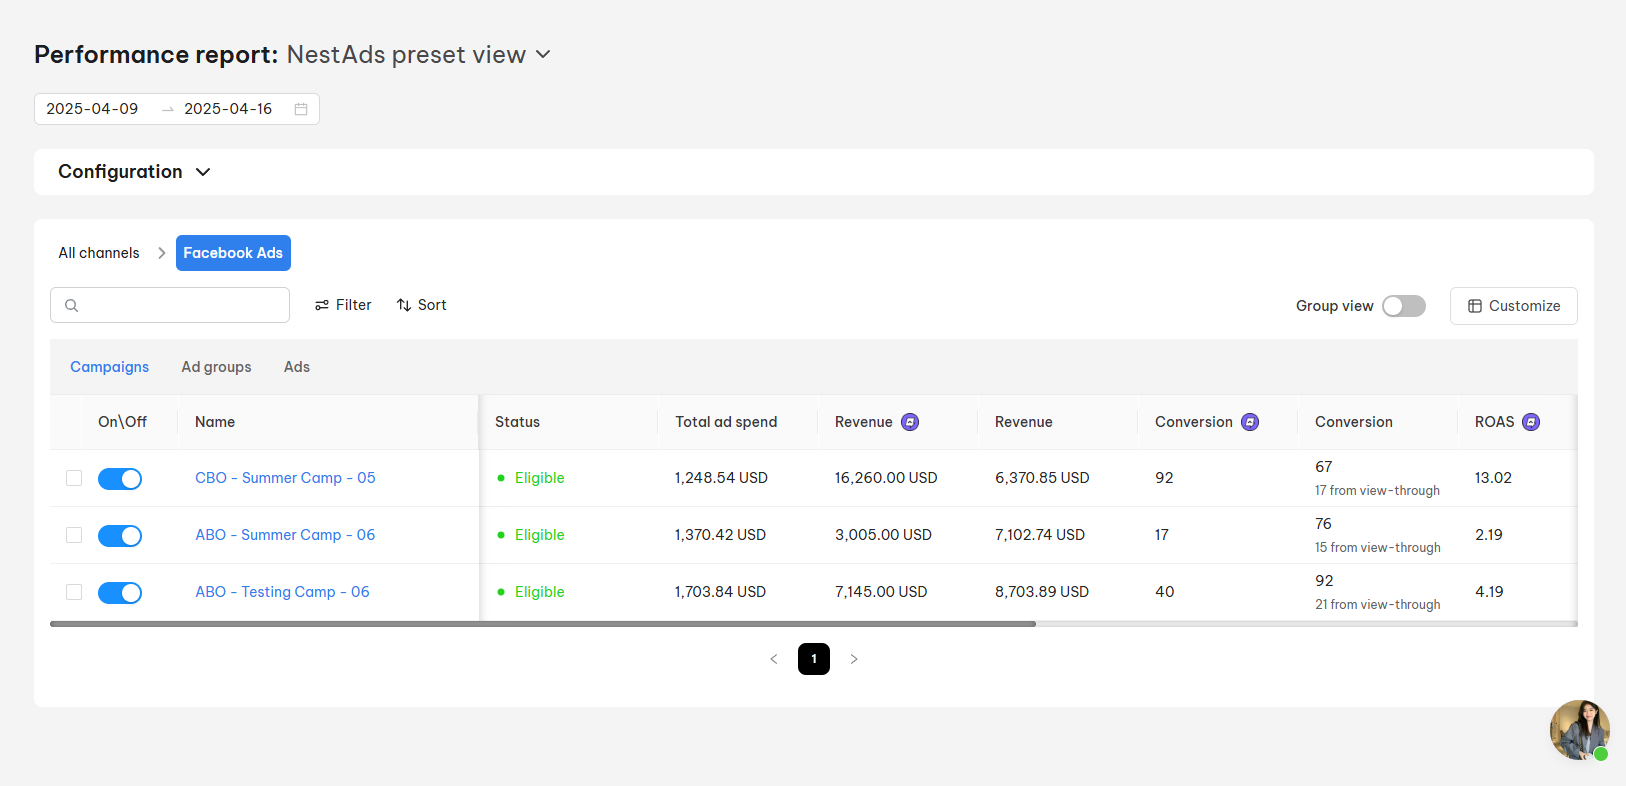
From the first row, you can quickly check all the metrics for each campaign (in a specific time period)
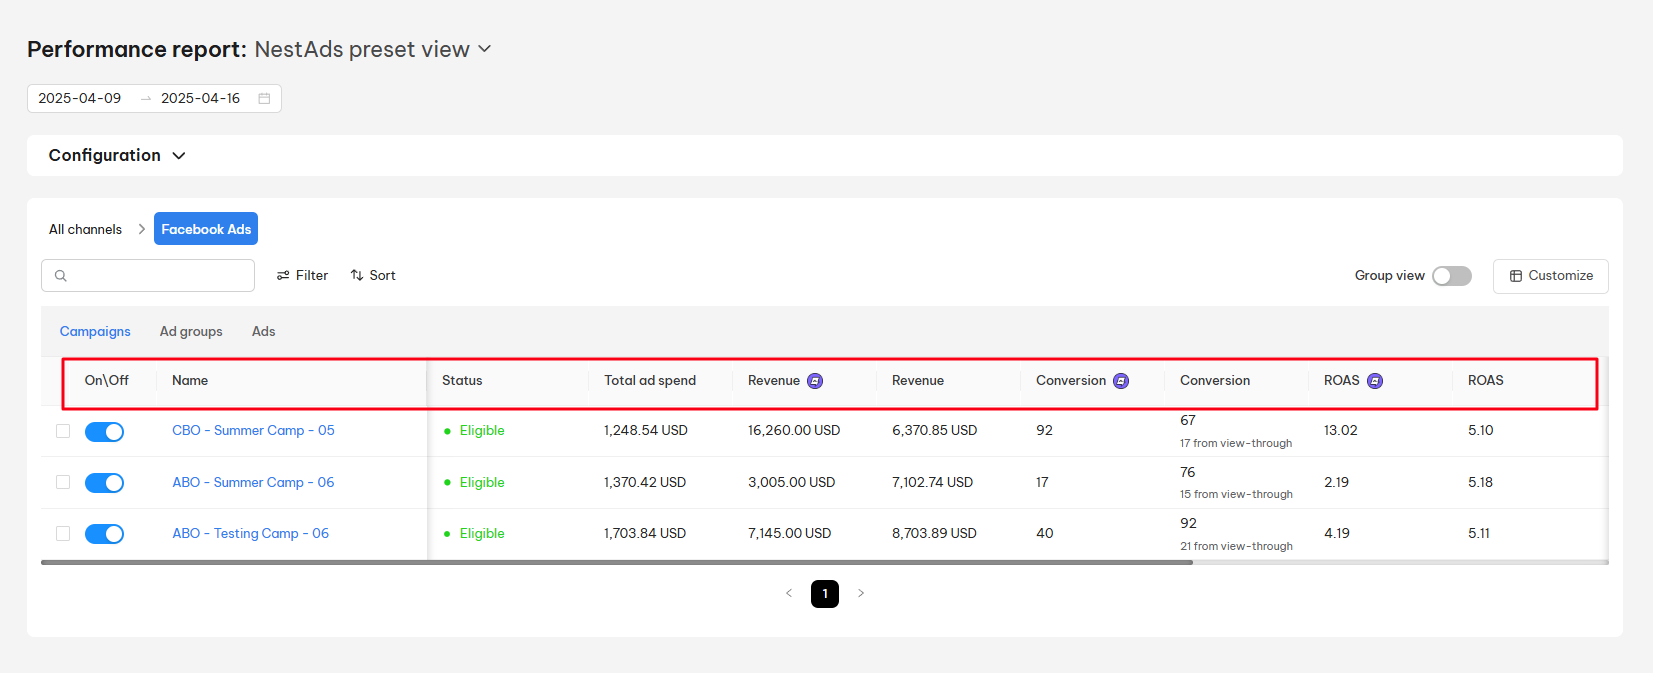
- Total Ad Spend: The total amount of money spent on your ad campaigns.
- Revenue: The total amount of money earned from ads.
- Conversions: The number of purchases completed by users after interacting with the ad.
- ROAS: Return on Ad Spend, calculated as Revenue/Total Ad Spend.
- Impressions: The number of times your ads are displayed.
- Visitors: The number of users visiting your site after interacting with ads.
- CVR: The Conversion Rate, calculated as the ratio of conversions to clicks.
You can click on the Group View button to display ads by group and campaign. This setup allows you to easily monitor ad performance within each campaign:
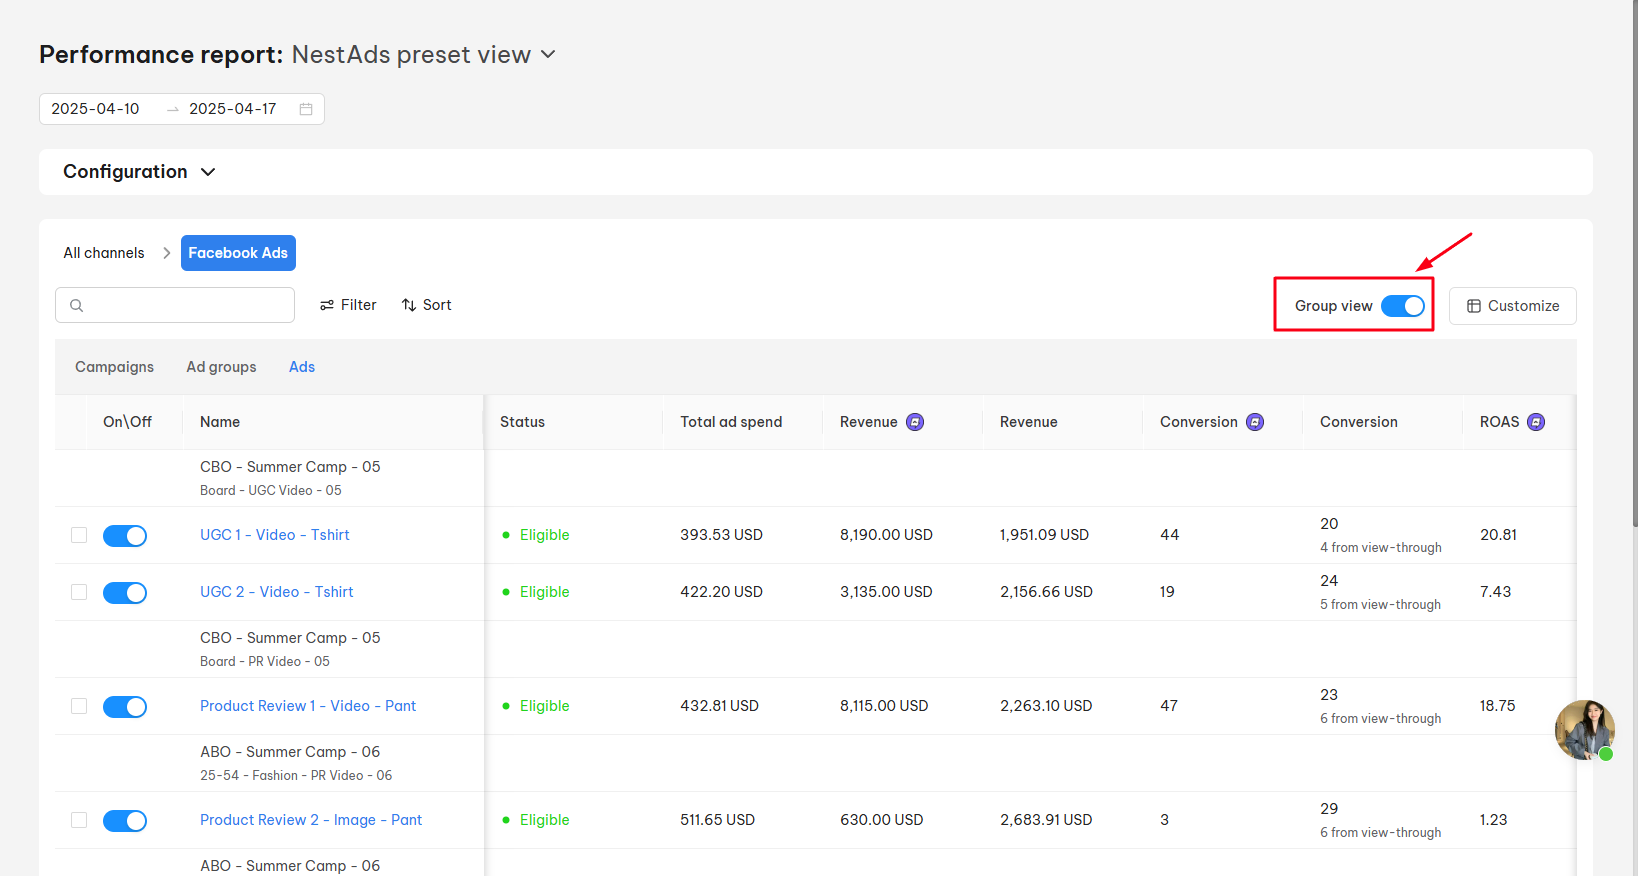
Note: Quickly switch the toggle On/Off directly in NestAds to activate/inactivate your ads.
Non-paid sources report
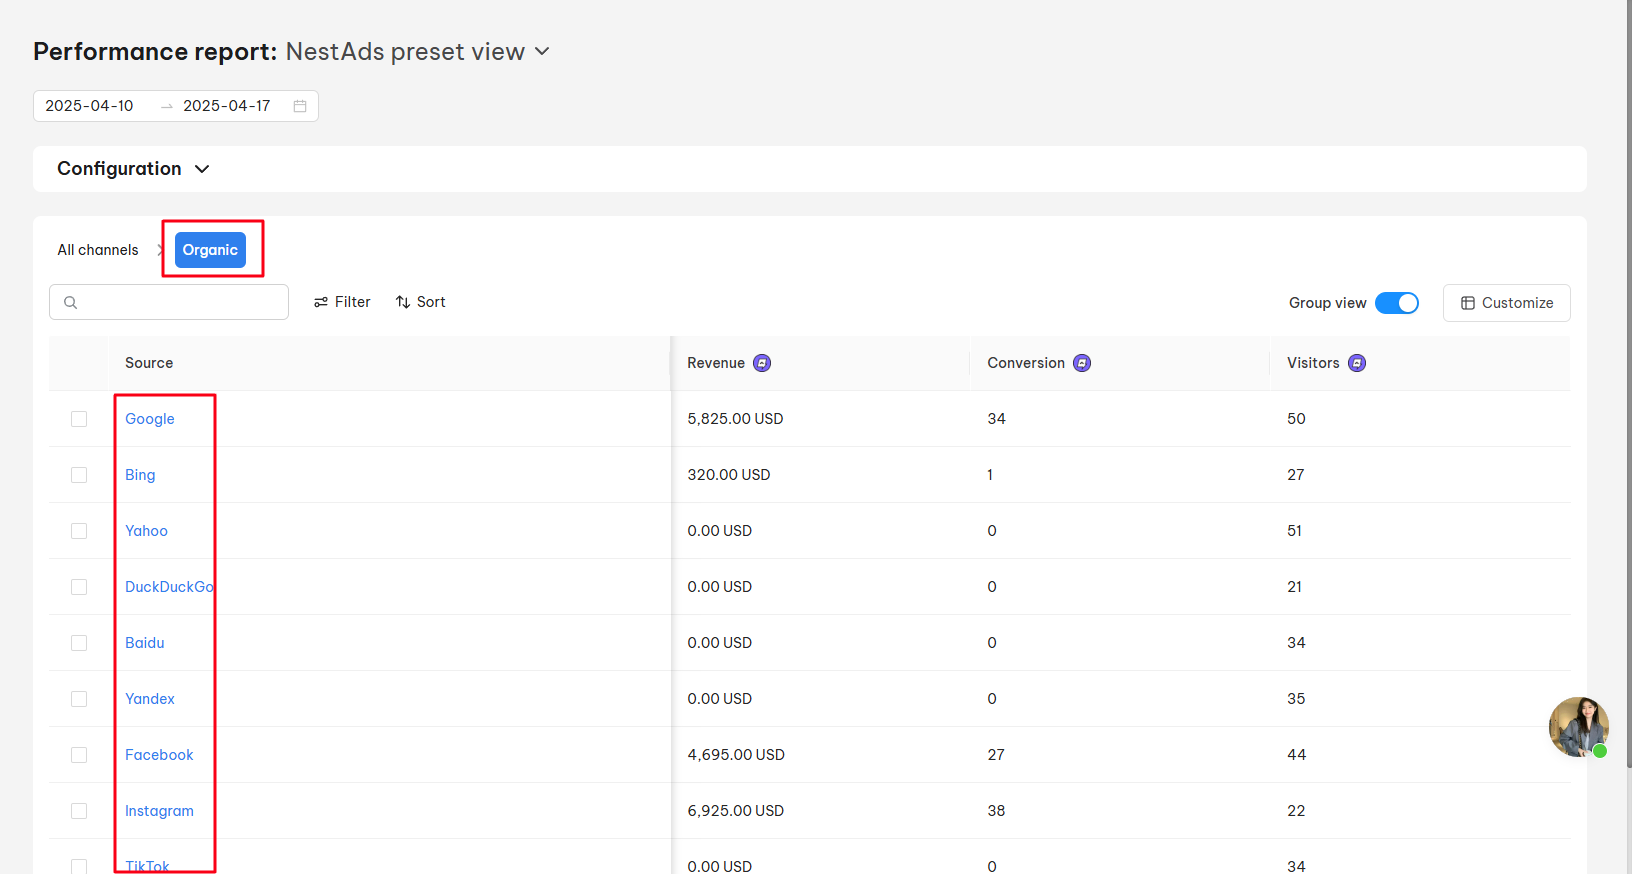
- Organic report
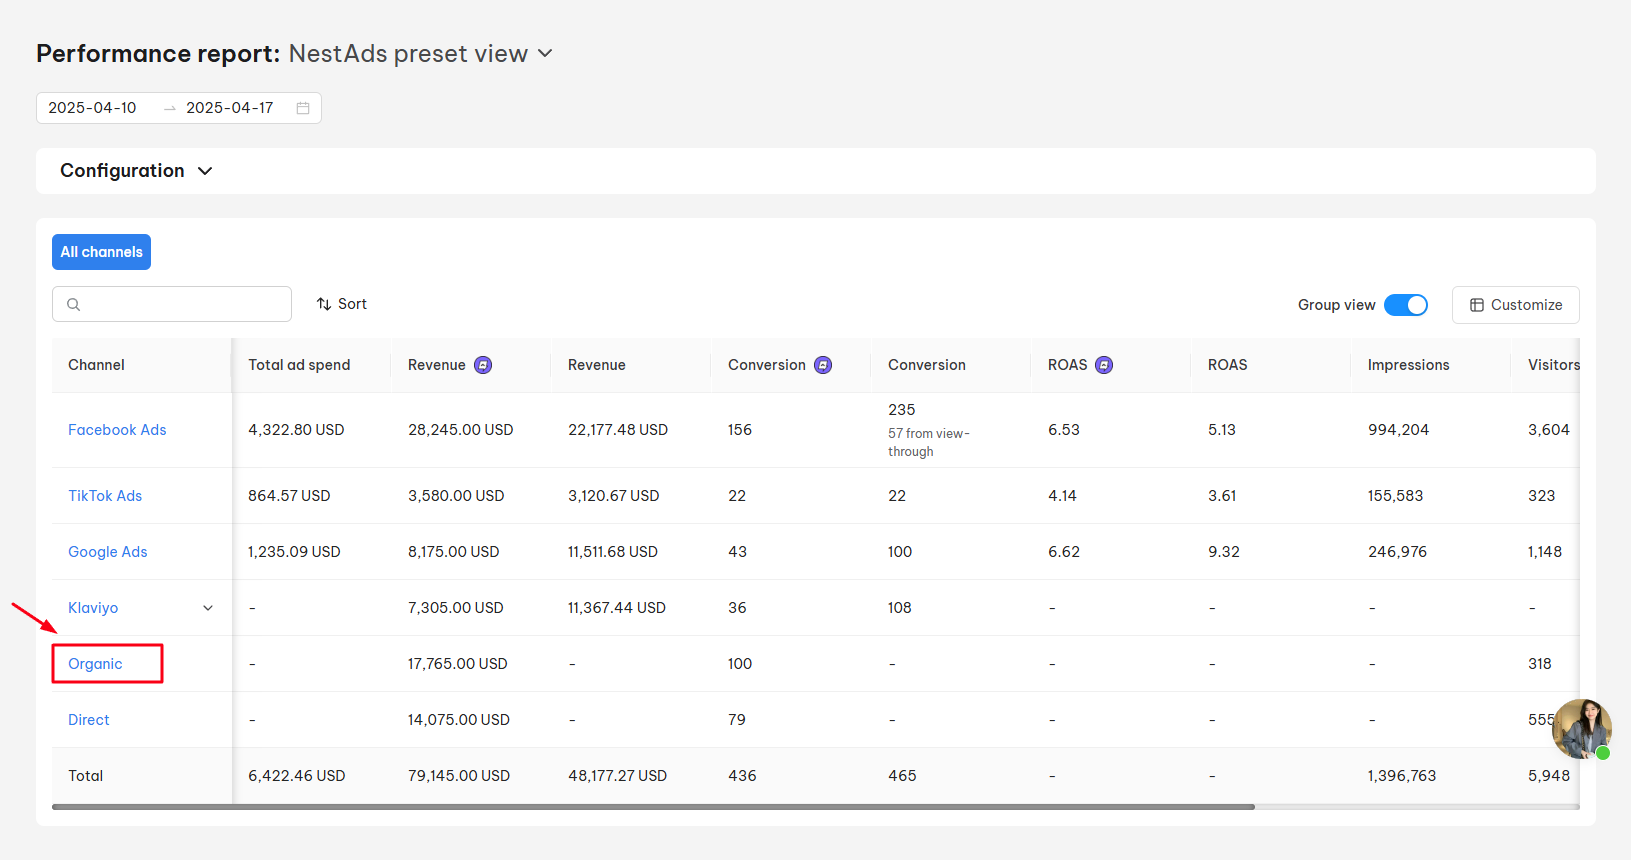
Organic reports offer a detailed breakdown of website traffic originating from non-paid channels. This includes metrics driven by non-ad links in organic search results (Google, Bing, Yahoo…) or on social sites (Facebook, Instagram, and TikTok).
- Direct report
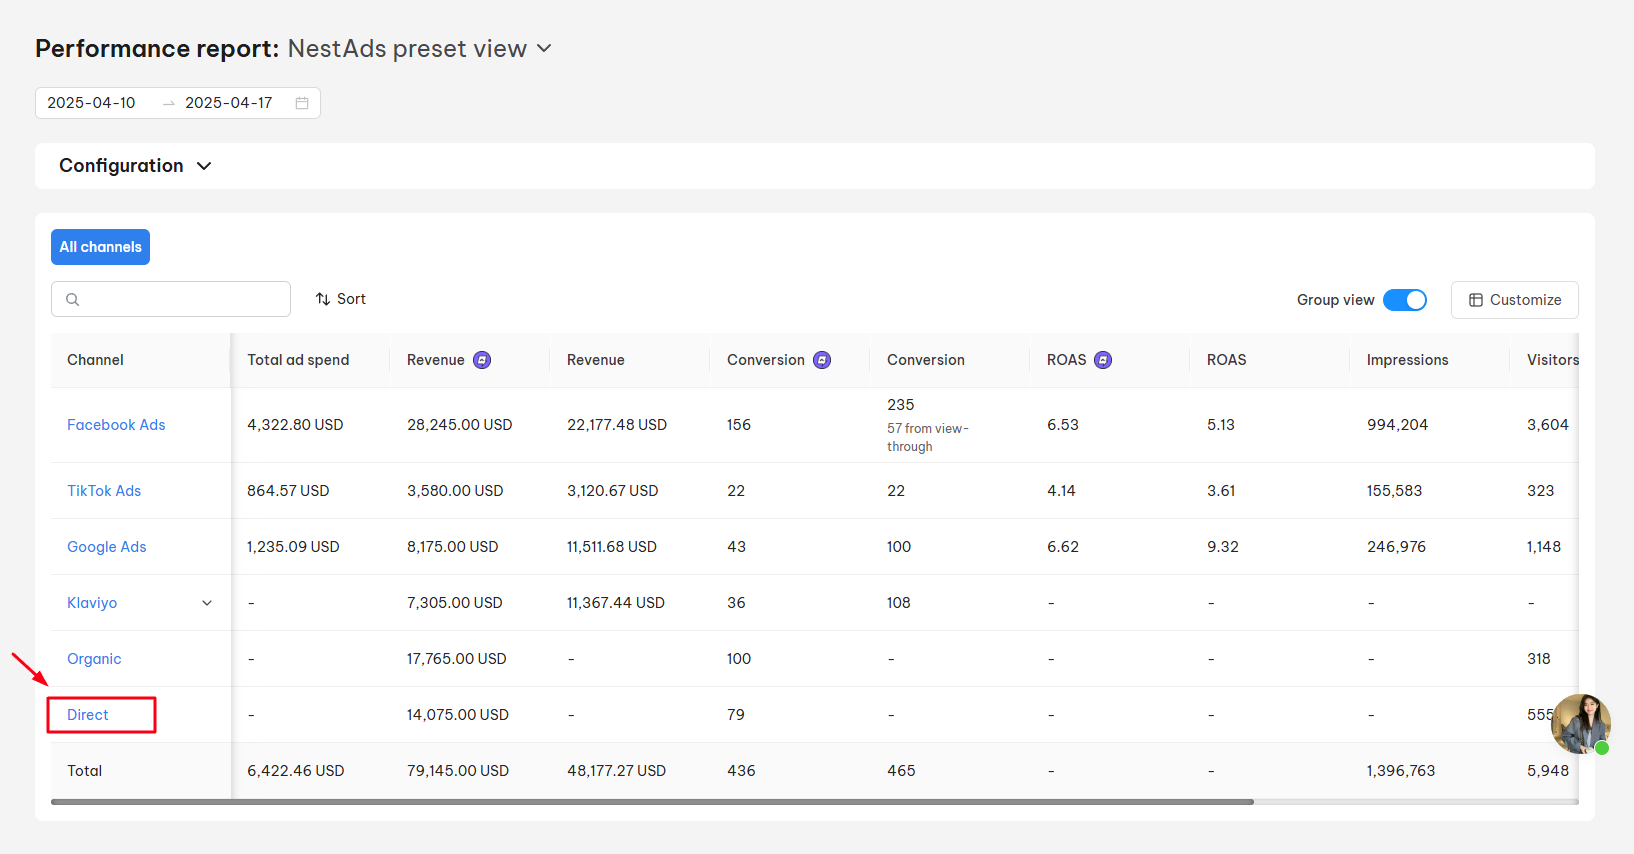
Direct report shows all the orders made by customers who visited your website by either clicking on a saved link or by directly typing your website’s URL into their browser.
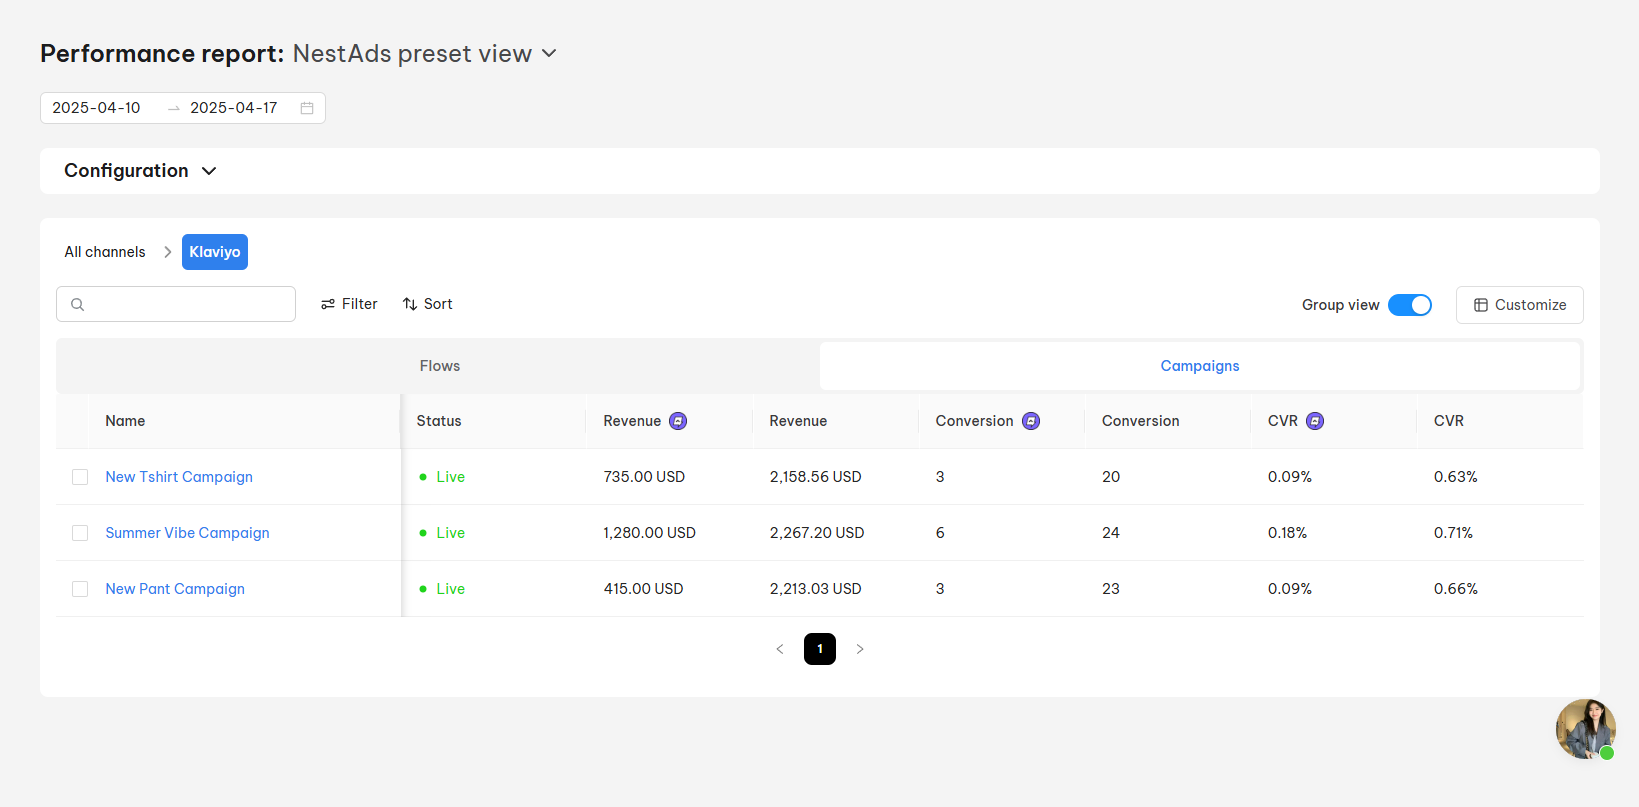
- Klaviyo report
If you’re using Klaviyo for email marketing, you can connect it with NestAds to access detailed reports.
The Klaviyo report in NestAds provides insights into which orders are attributed to specific campaigns or automated flows within Klaviyo.
>> Learn more: Klaviyo Integration
- Custom source report
Other than setting the custom rules of attributed traffic for the default settings by the advanced conditions, you can also launch advertising campaigns on various platforms, including those not directly integrated with NestAds, such as:
- Email marketing (other than Klaviyo)
- Affiliate links
- Other search engines not currently listed in NestAds
- …
By setting up UTM tracking for these custom traffic sources, you can generate a report that shows orders attributed to those sources.
>> Learn more: Custom traffic rules
How to filter NestAds performance report
Let’s take a closer look at all settings, columns, and metrics in NestAds Pixel performance report.
On the top of the performance report, you will see some filters, including:
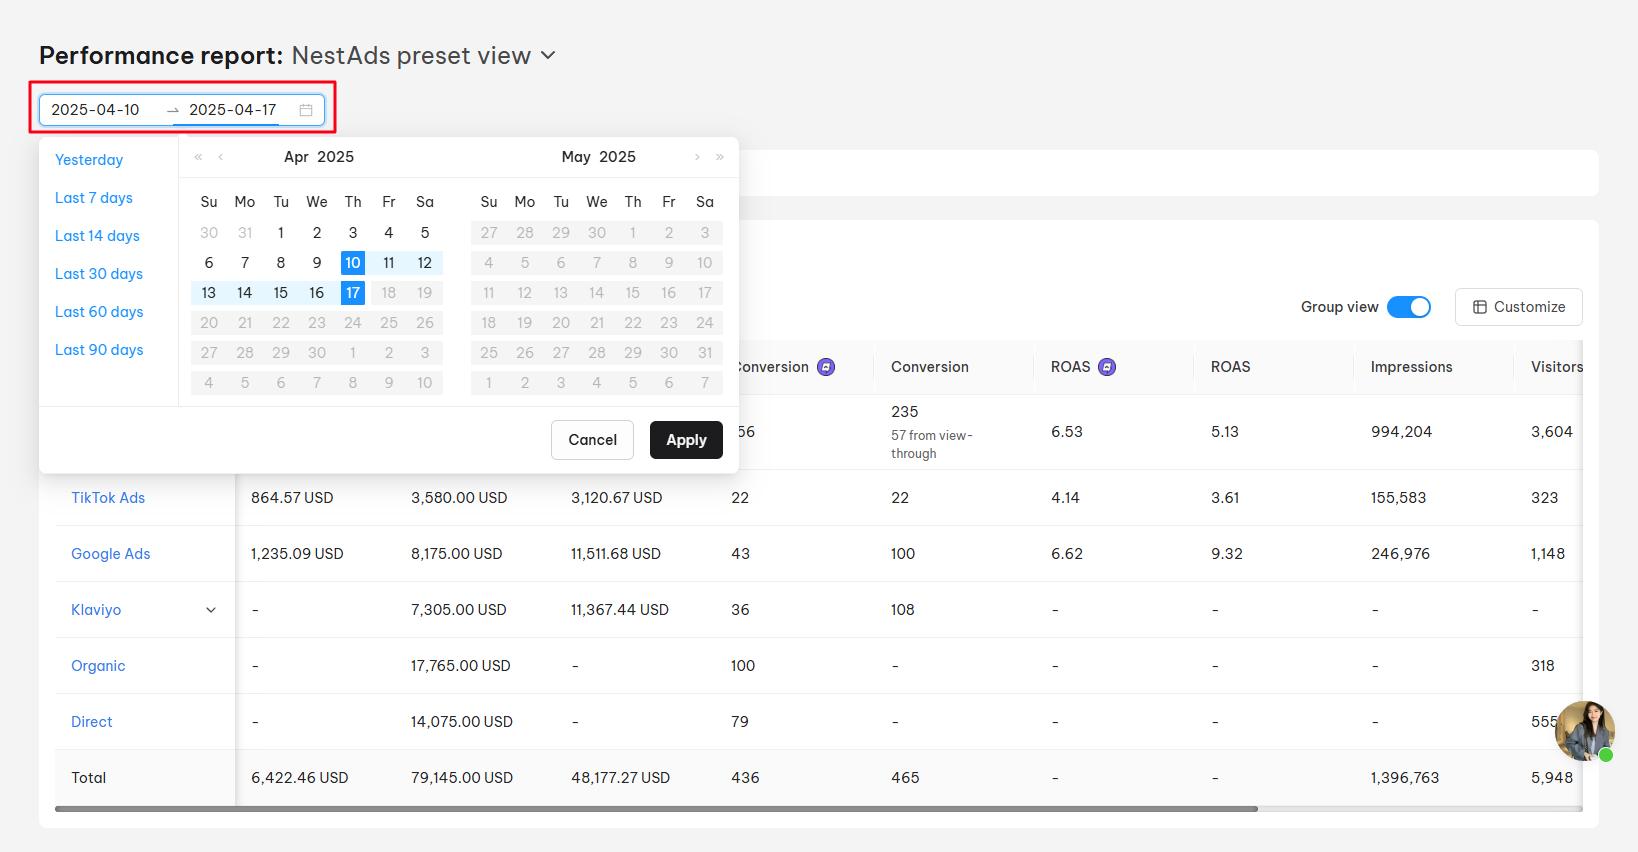
- Date range
There are some predefined date ranges for you to select from: Yesterday, Last 7 days, Last 14 days, Last 30 days, Last 60 days, Last 90 days. You can set a custom date range as you want.
Tips: Select a date range that is reasonable for your customer buying journey.
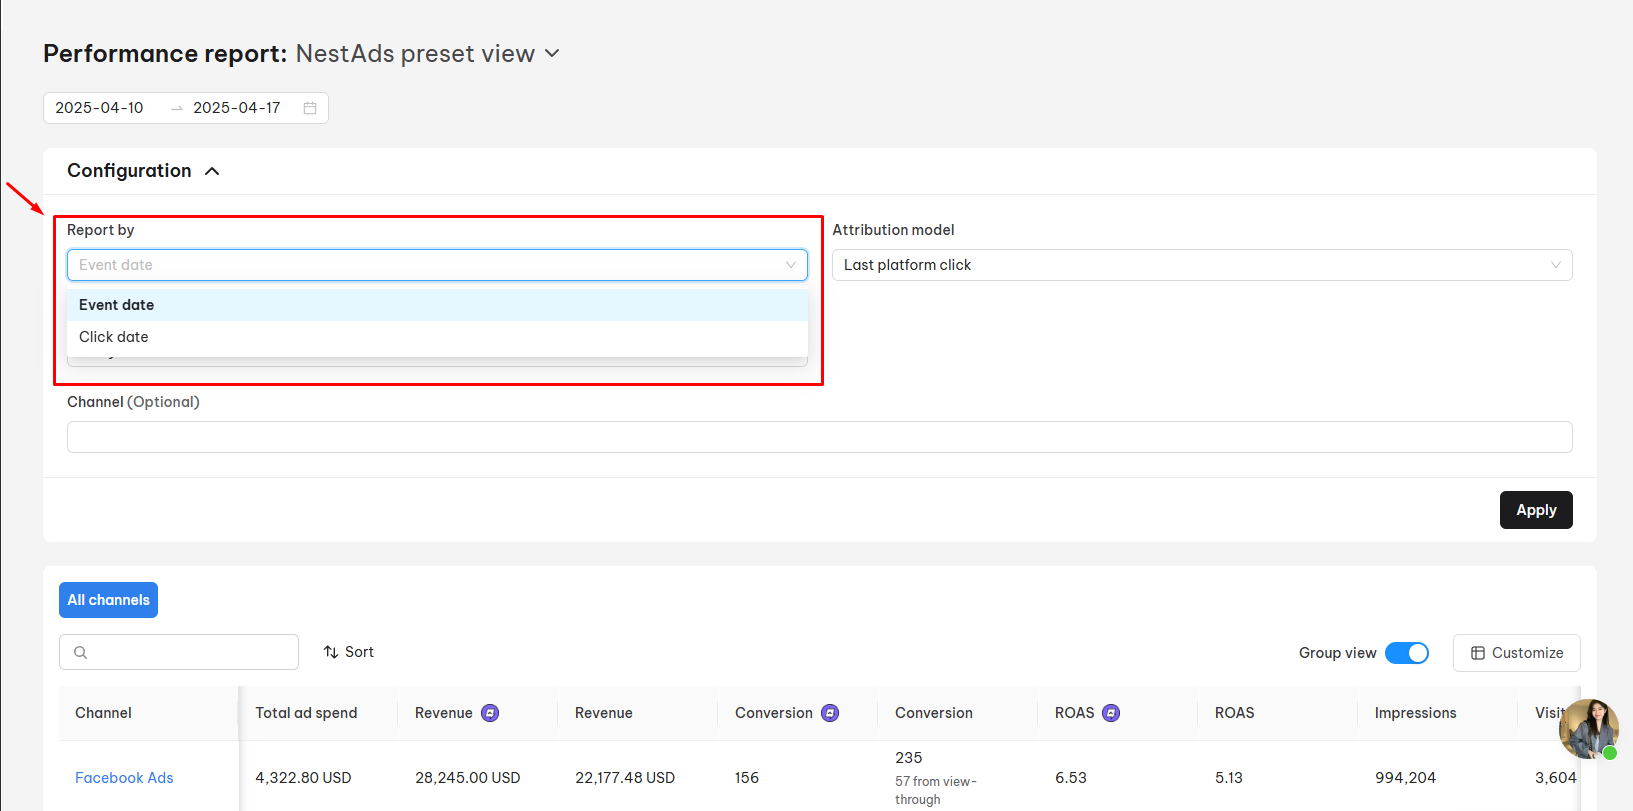
- Model date (Report by)
Select the date of which action you want to track. There are 2 options for you:
- Event date: The day the customer makes a purchase
- Click date: The day the customer clicks on an ad
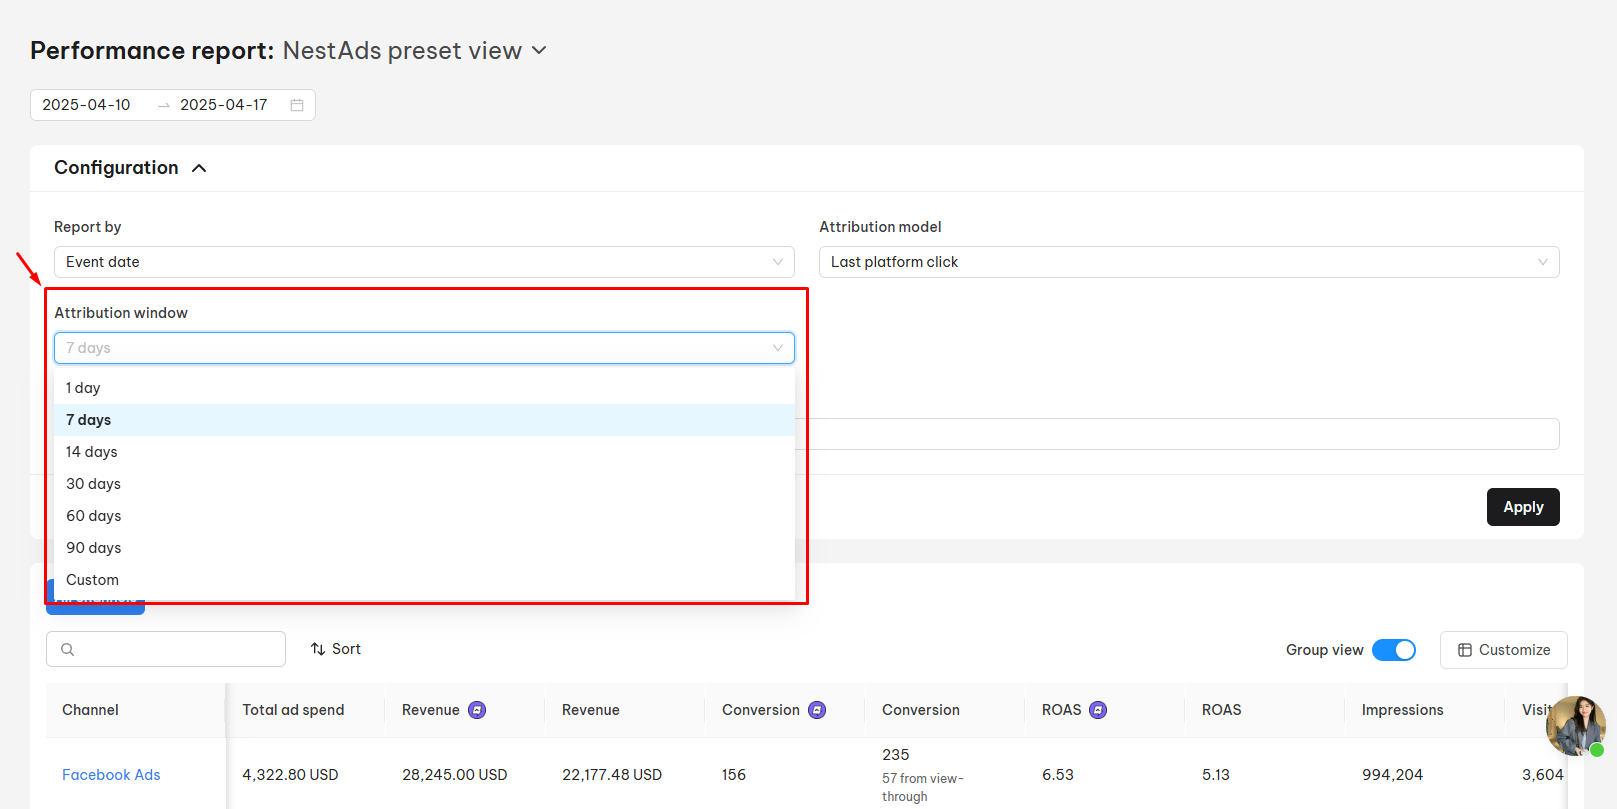
- Attribution window
This is a defined period during which events are tracked and attributed to an ad. NestAds offers six options: 1 day, 7 days, 14 days, 30 days, 60 days, and 90 days.
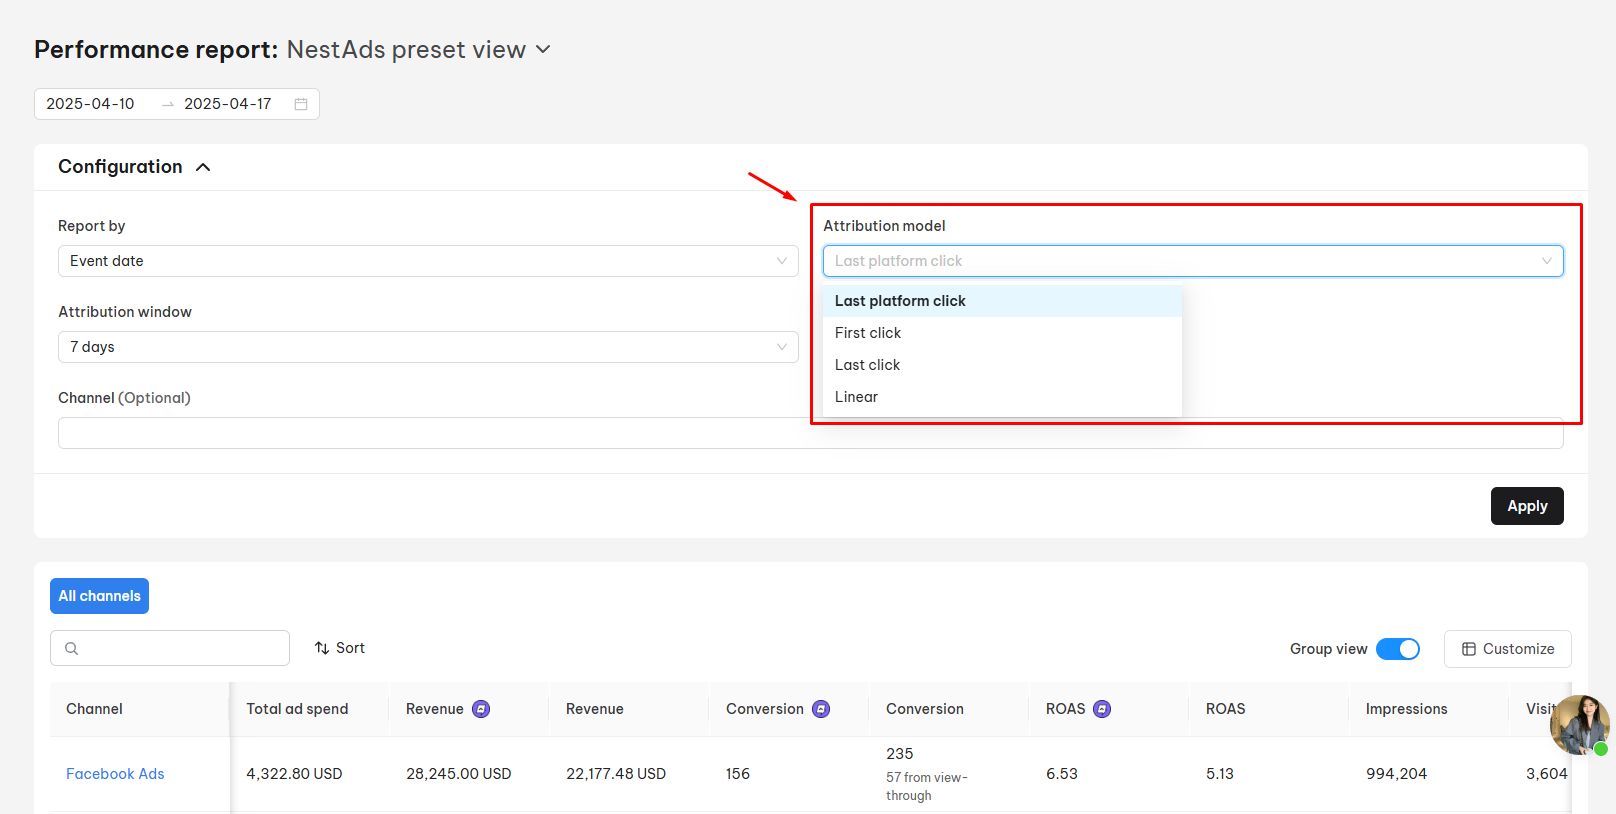
- Attribution model
Attribution models determine how order values are attributed across touchpoints. There are 4 options you can choose: Last platform click, First click, Last click, and Linear.
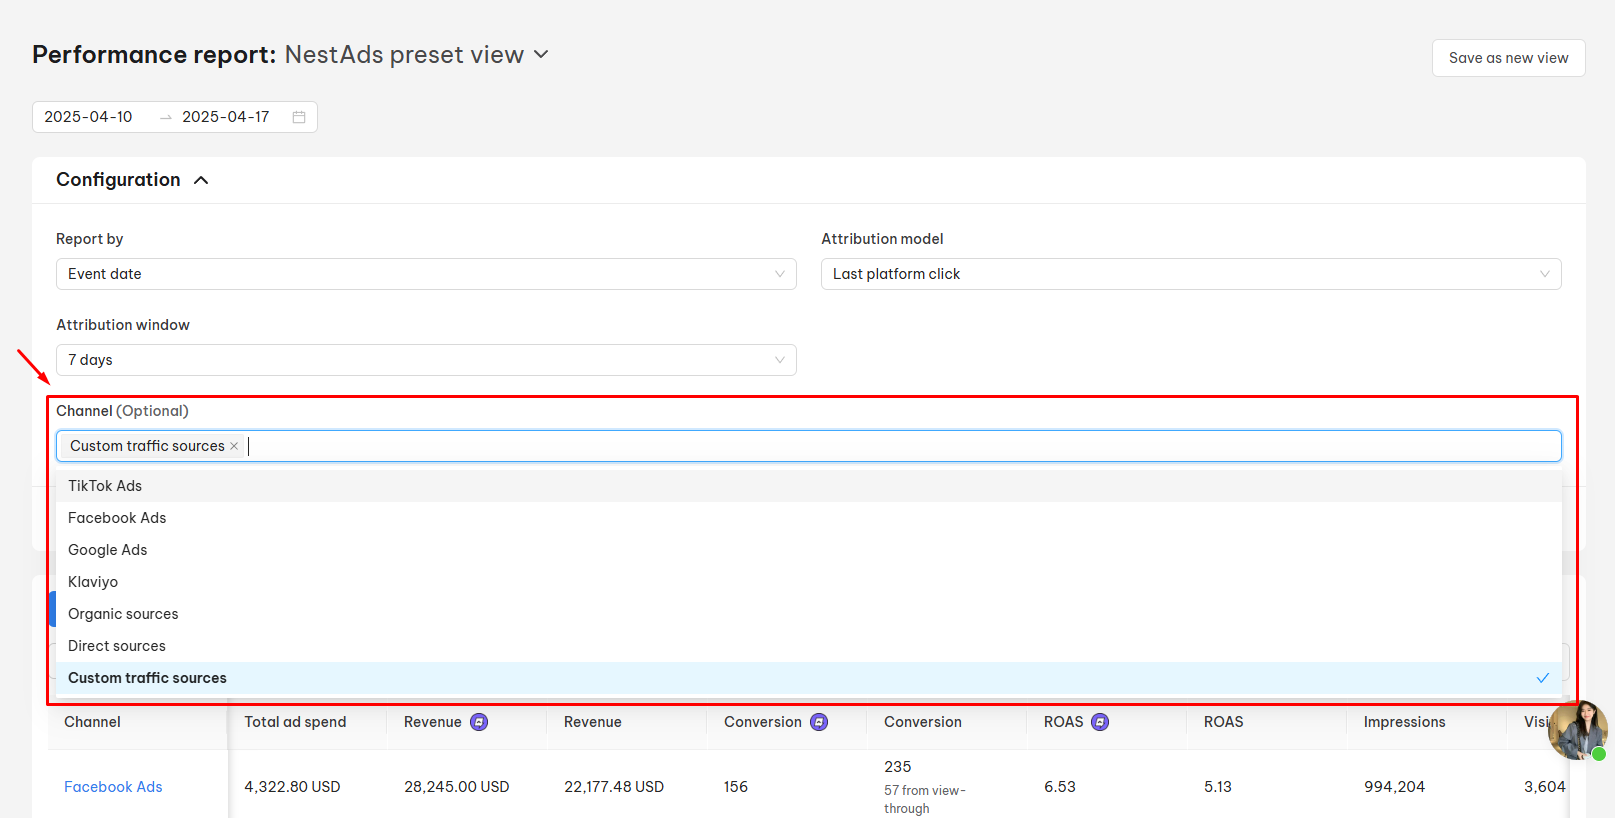
Channel: NestAds allows users to display metrics of all channels or only specific channels on the performance report.
In NestAds Pixel performance report, you can filter by Campaign Status or Metrics by clicking the filter icon beside the search box.
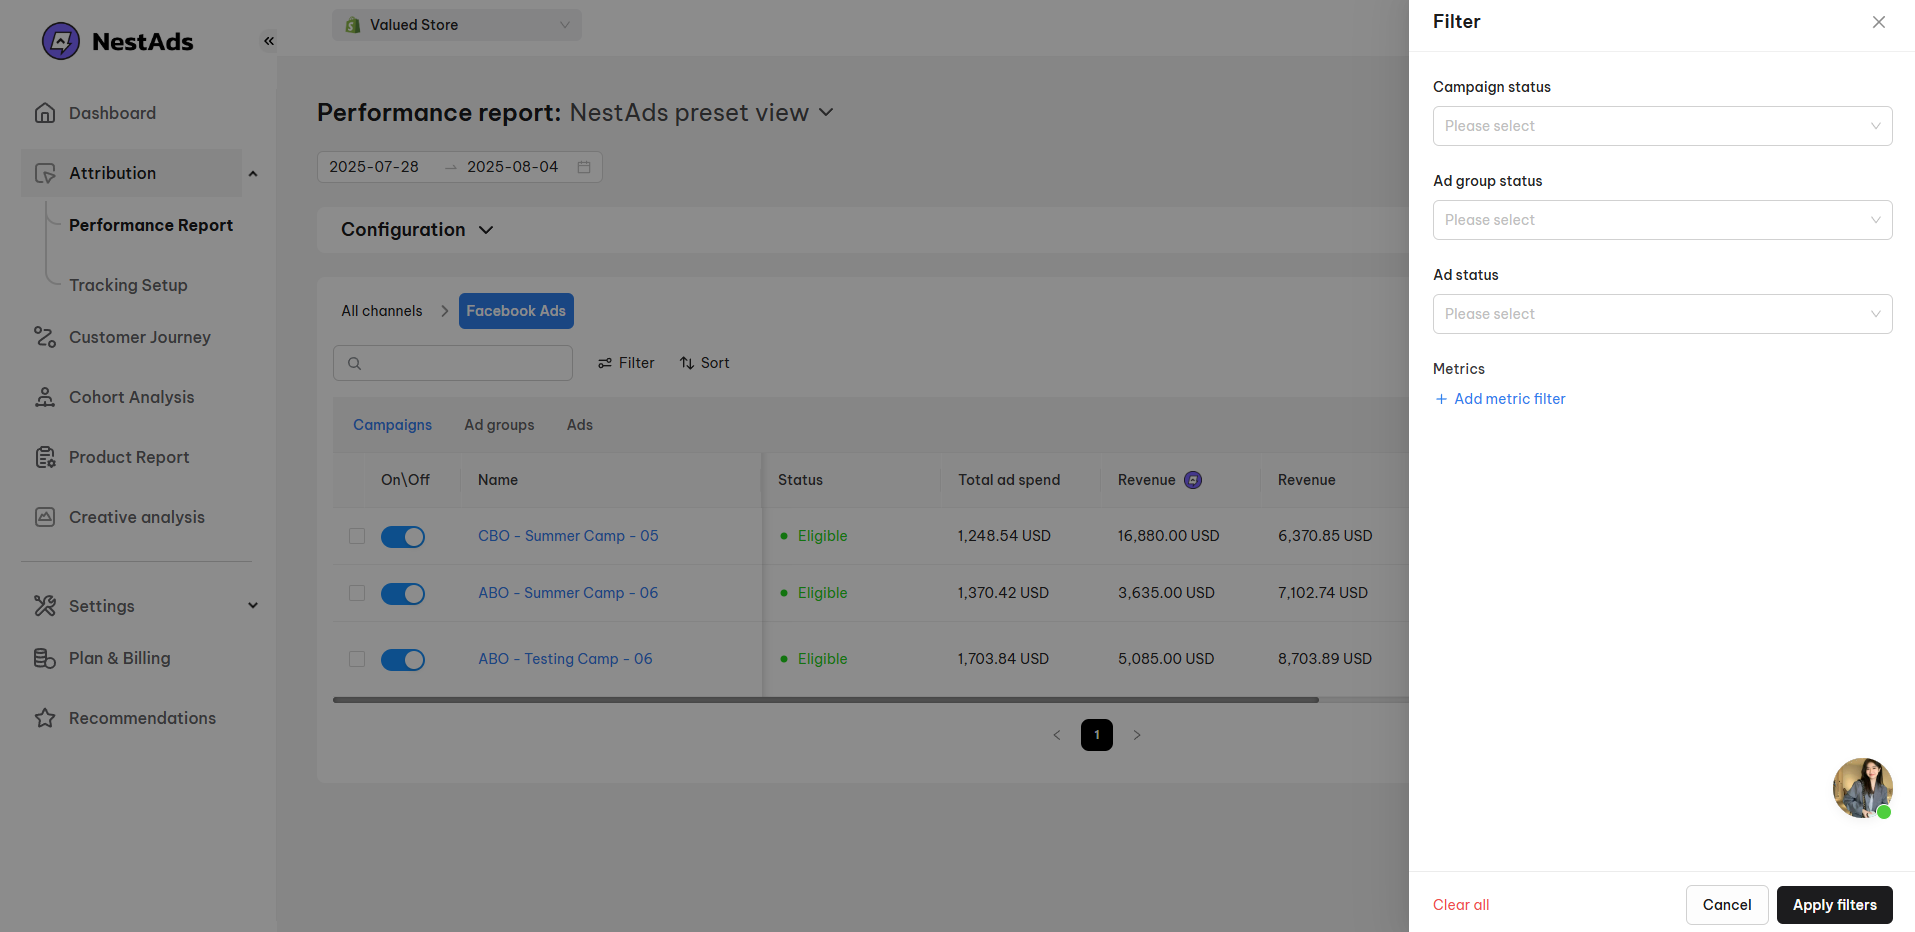
When the sidebar appears on the right, simply tick the boxes to select the filters you want to apply to your report:
- By Campaign/Ad Group/Ad Status
- By Metrics
You can use a single metric filter or combine multiple ones. Click Apply Filters to finalize your selection.
How to create NestAds Saved View
Customize your Performance Report to suit your needs by adjusting configurations like date range, reported metrics. Once done, you can save it as a new view for easy access and management.
Customize NestAds displayed columns
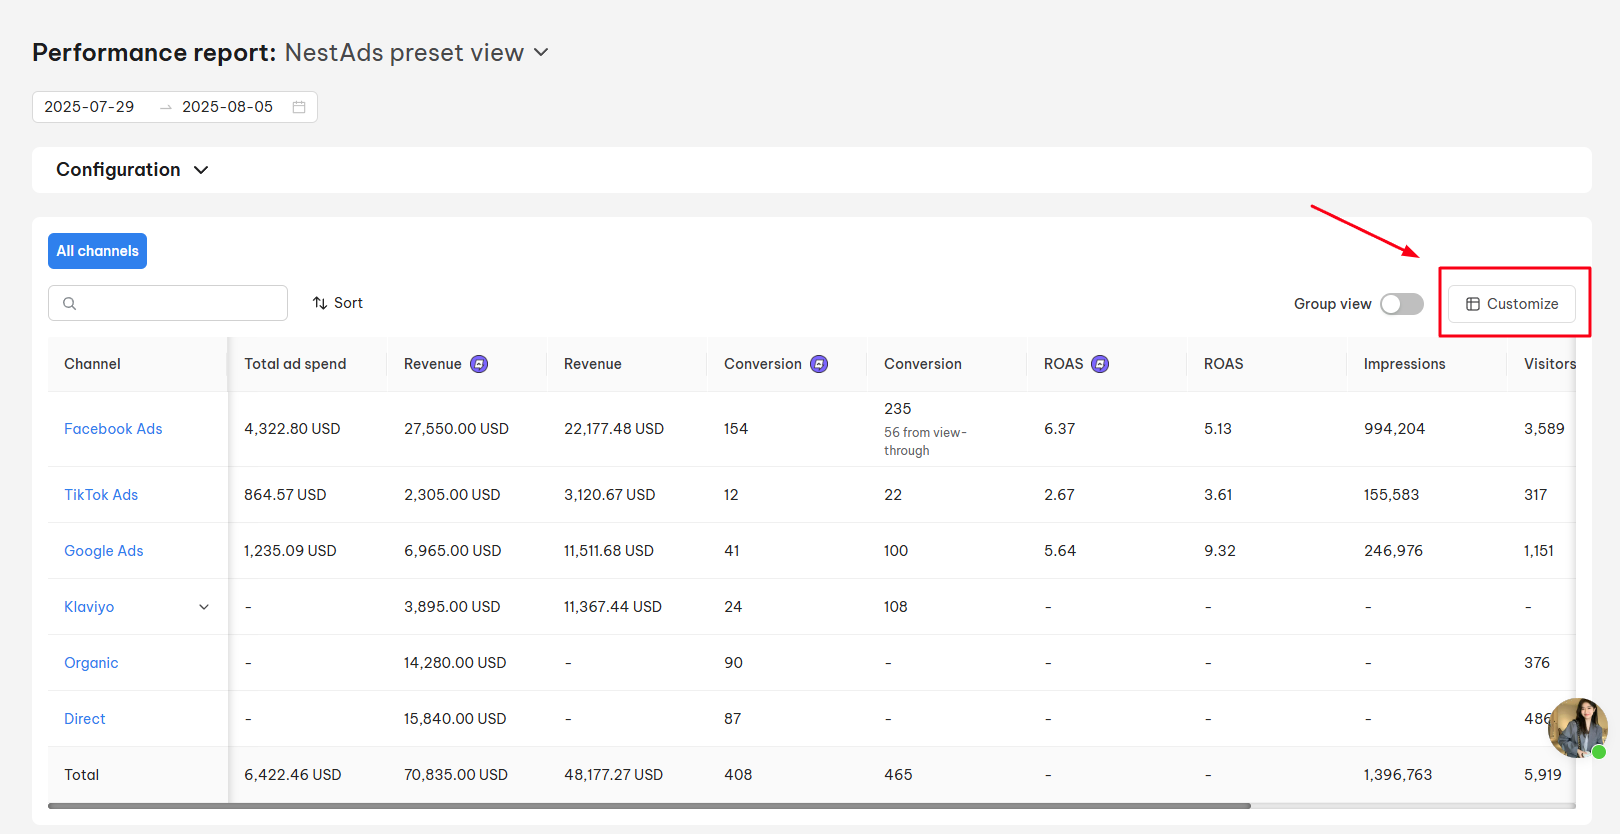
You can customize your Performance Report by clicking the custom symbol at the top right corner of the report.
When the pop-up window appears, simply tick the boxes to select the metrics you want to showcase in your report.
*Note: Total ad spend metric is a default metric and cannot be hidden on your report.
To organize the order of these metrics, click on the drag-and-drop icon under the Column Display section. After that, click the Apply button to save your changes.
Save a NestAds Custom View
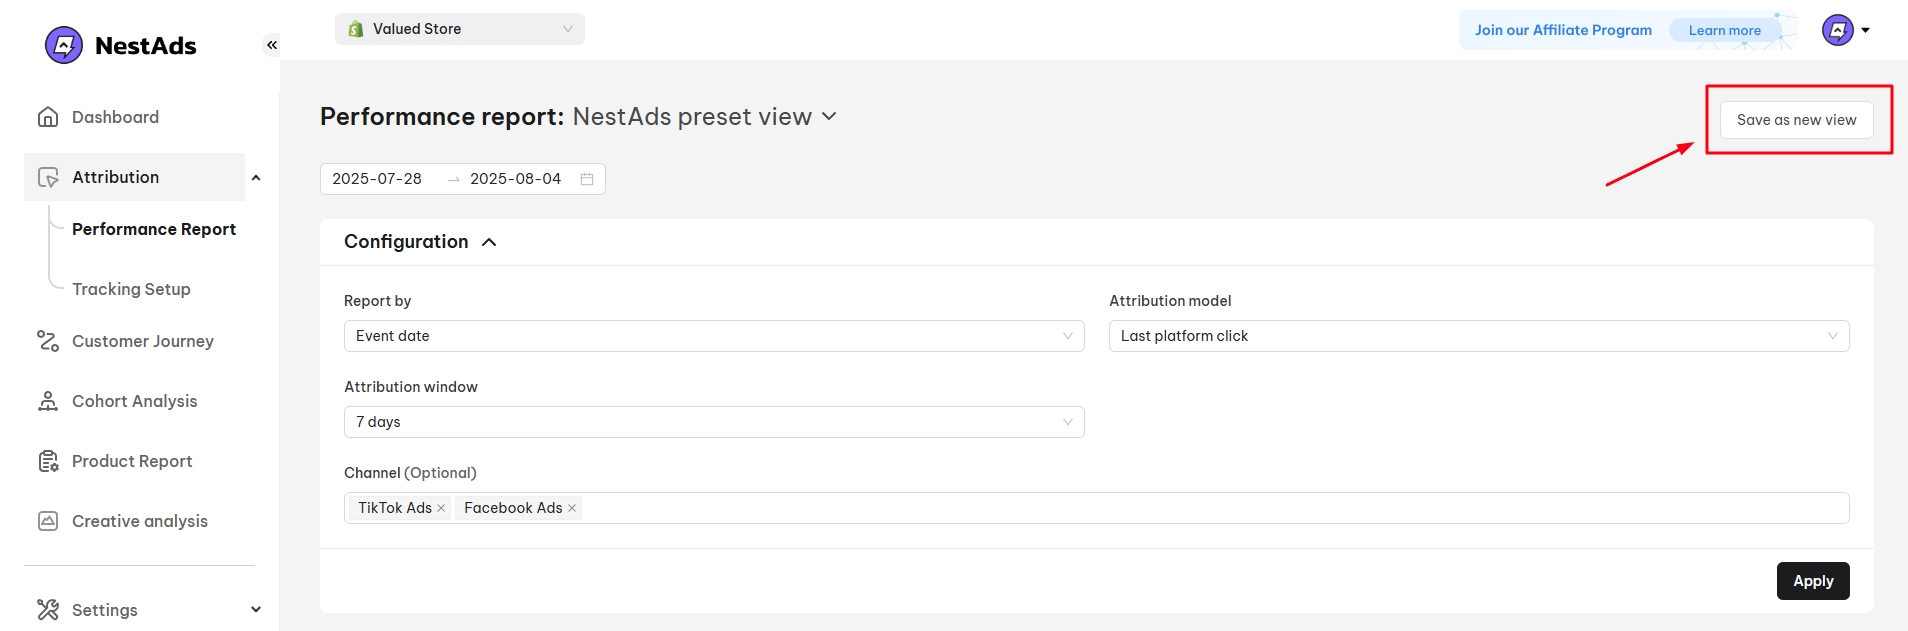
- After making changes to your current Performance Report, click on the Save as new view button:
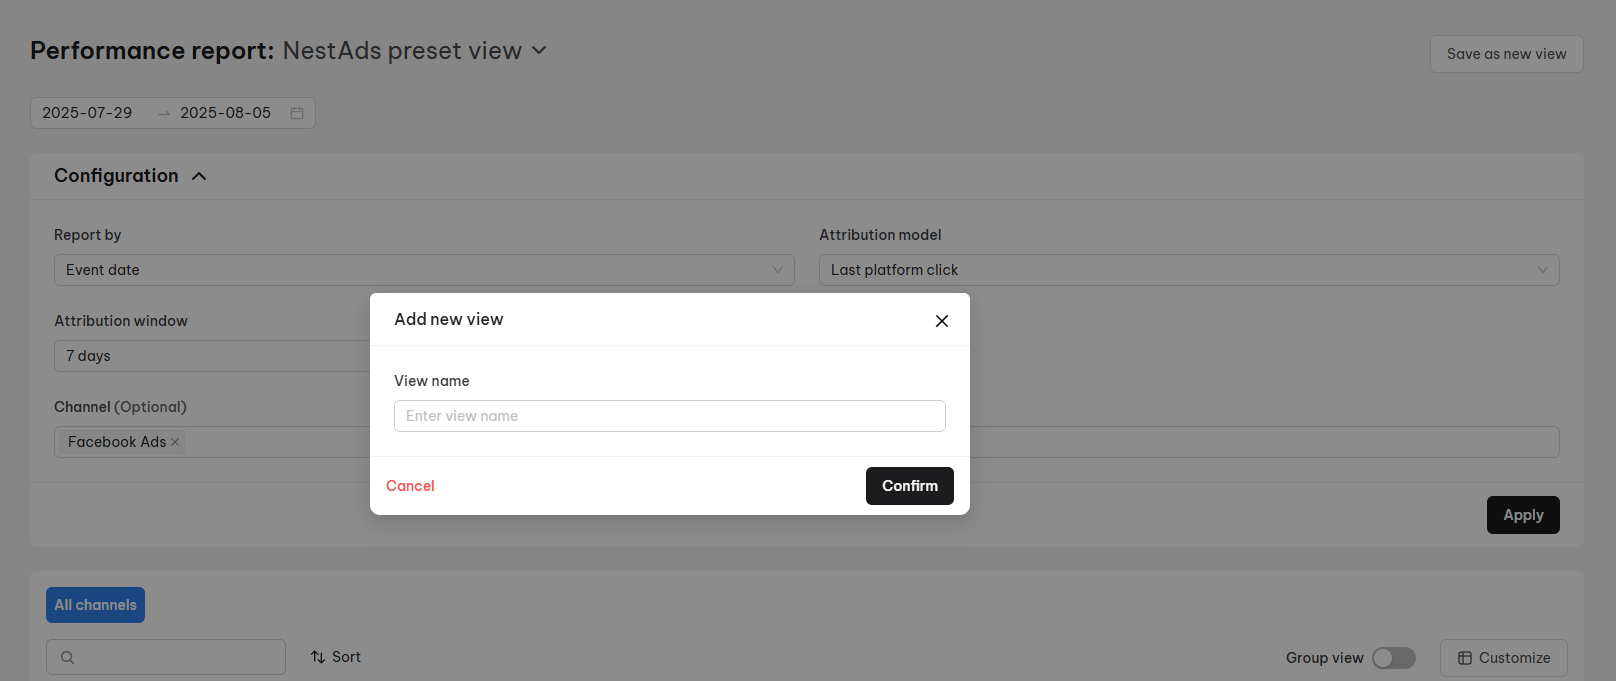
- Inside Add new view pop-up, type the View name > choose Confirm
Edit a NestAds Saved View
When you’ve made changes to your Performance Report, “Unsaved changes” will appear. You can then choose to:
- Save: Apply the changes to the current view
- Save as New View: Save it as a separate saved view
- Edit View Name: Save changes to the current report under a new name
- Delete View: Remove the current report view
You can set a view as a default view to display automatically when logging into NestAds Performance Report by clicking on the Star Icon in the top right corner:
(The default view is NestAds preset view)
Details of NestAds Pixel performance report
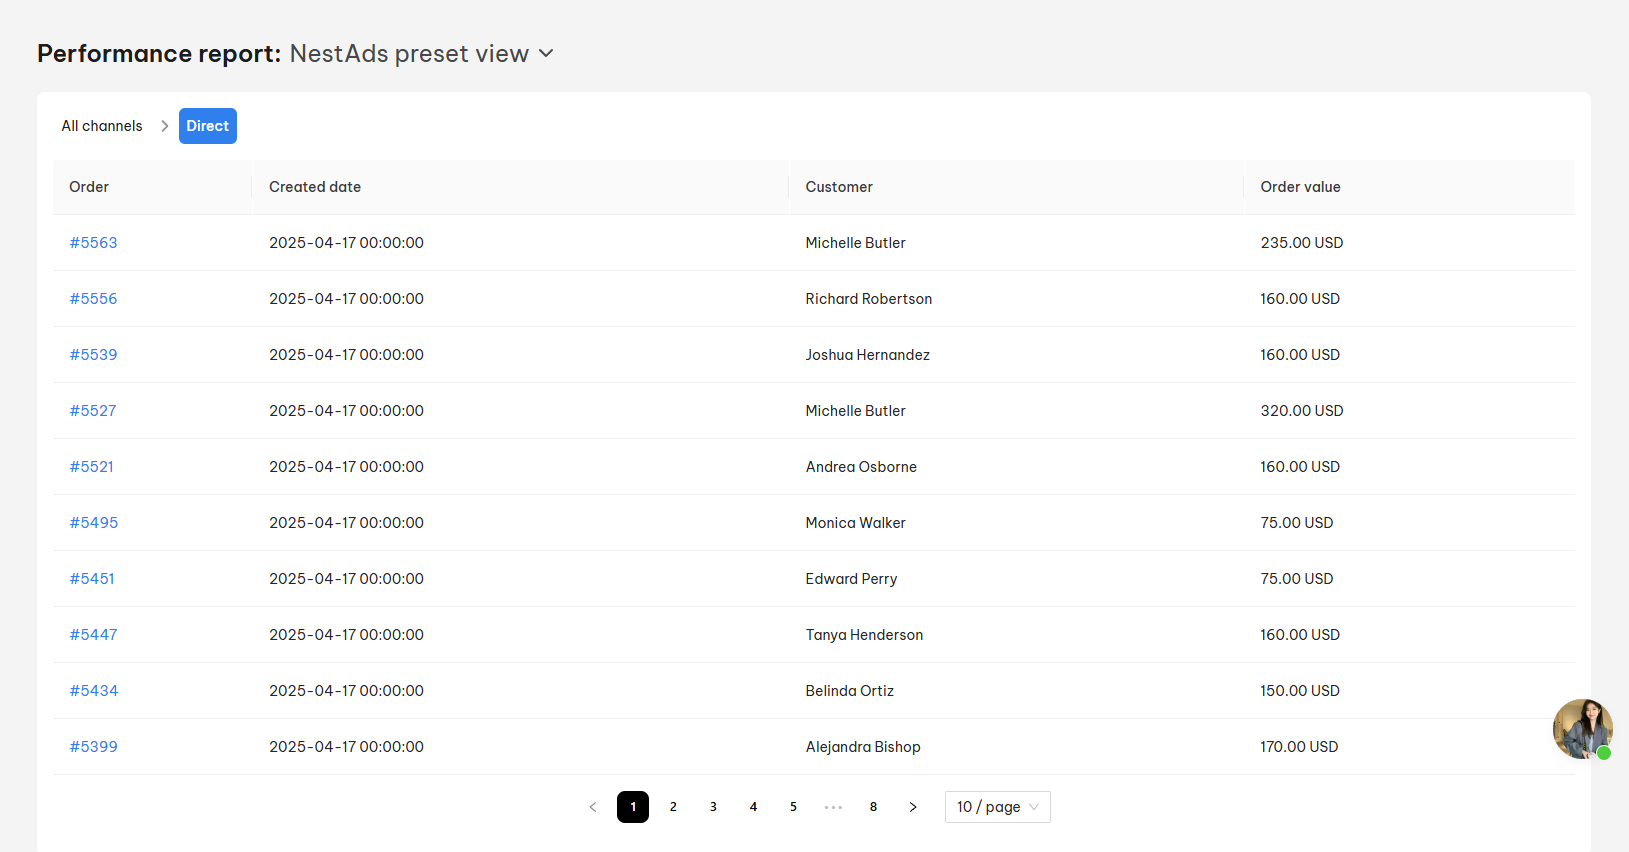
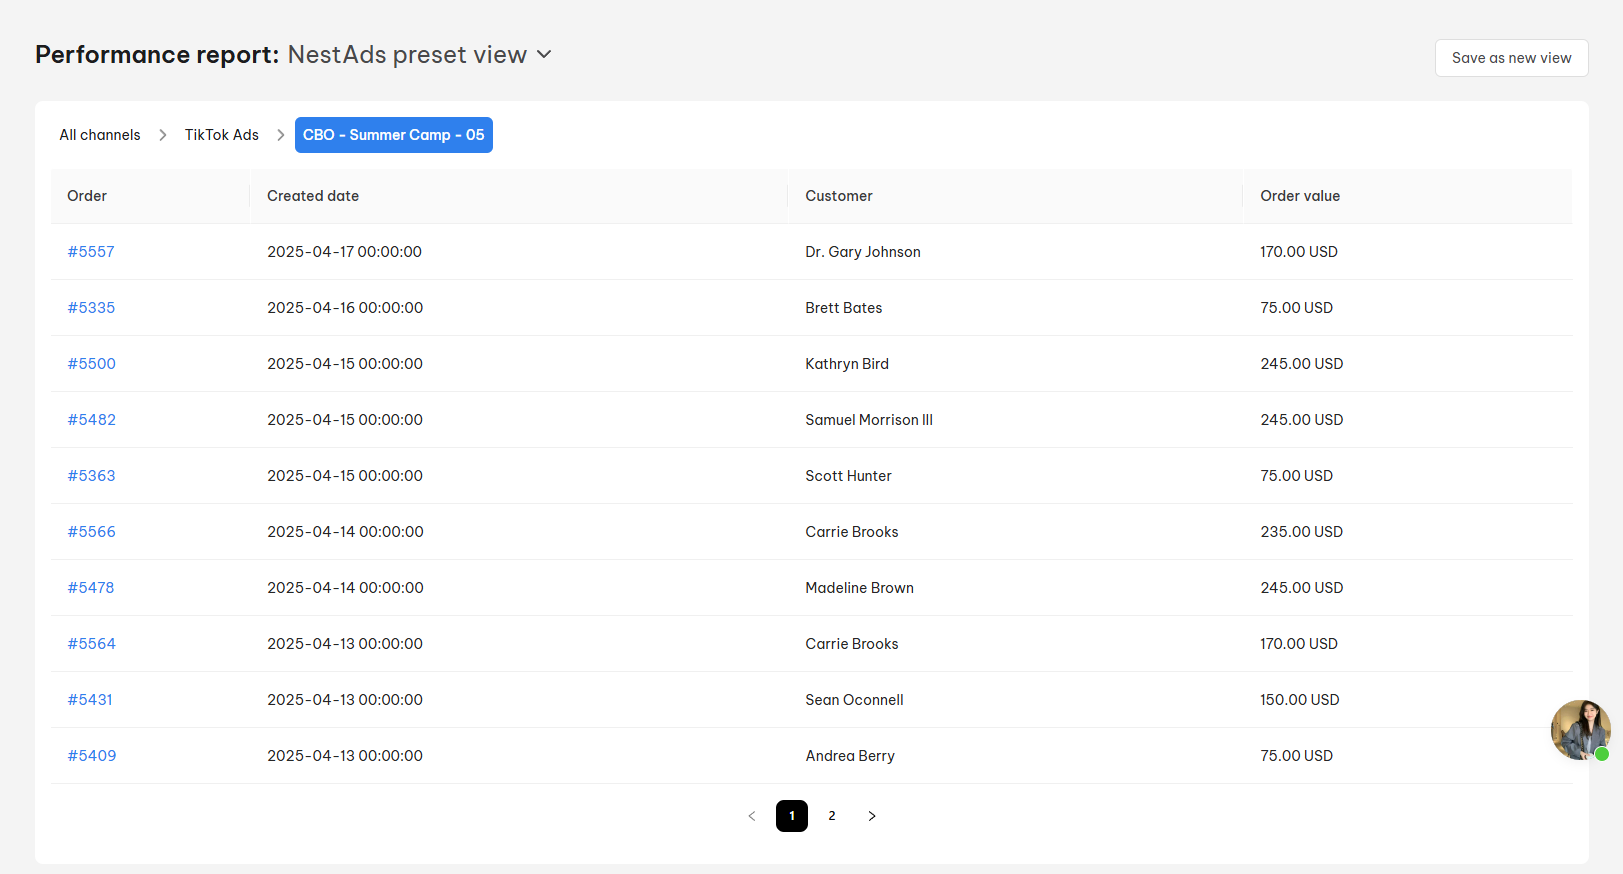
If you want to view the detailed sales performance of a specific campaign, simply click on its name.
For example, if you click on Campaign A from TikTok Ads platforms, you’ll see the list of orders generated from that campaign. Specifically, it shows the Order Number, Created Date, Customer Name, and Order Value.
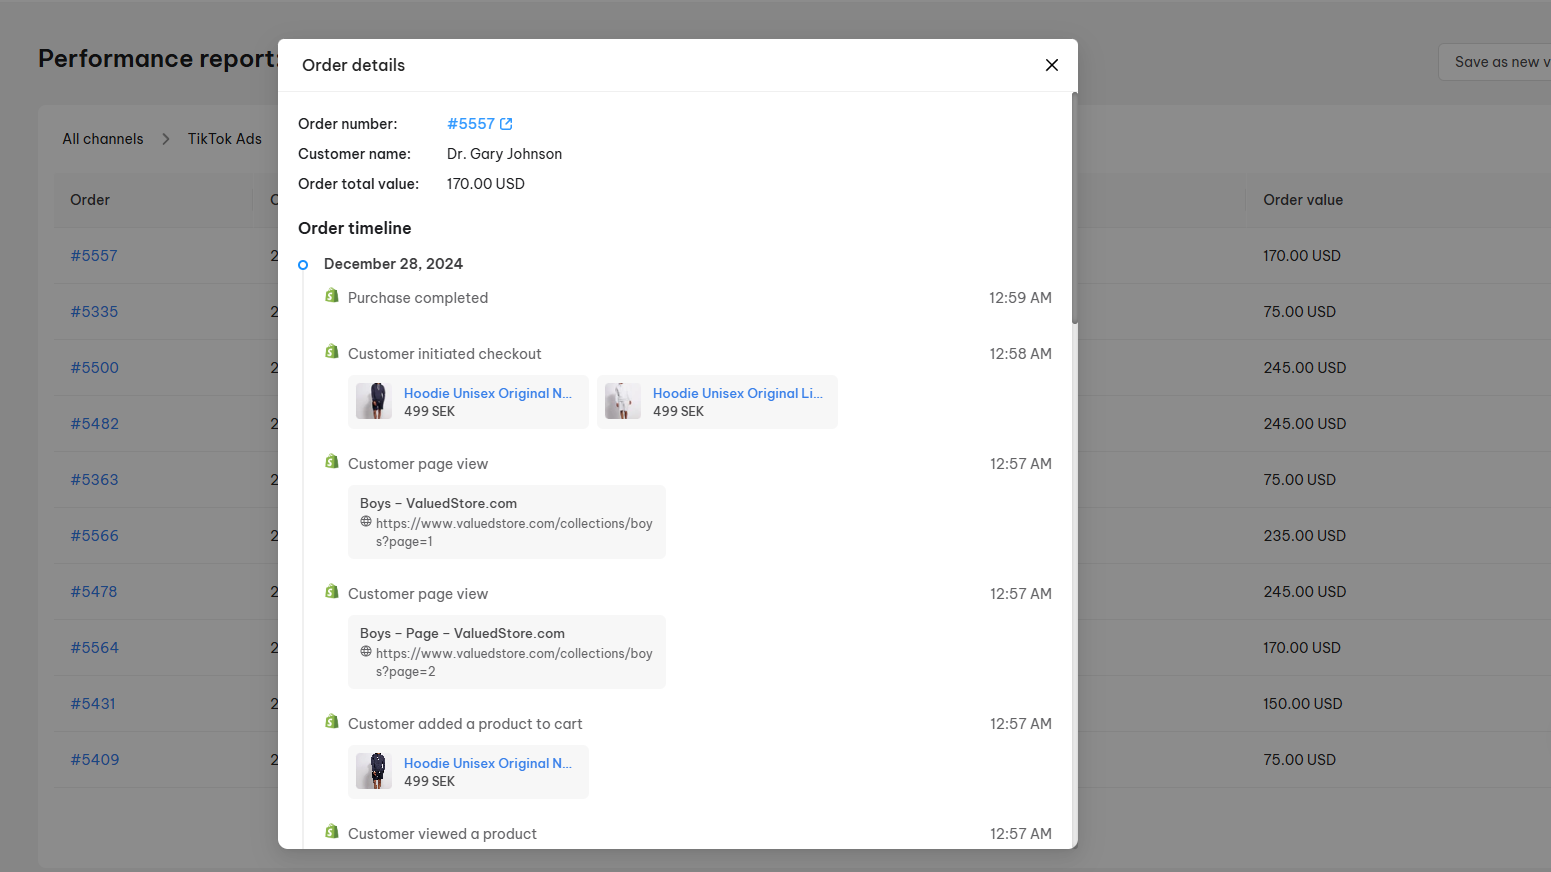
If you click on a specific order, you can view the list of purchased items and the timeline of all customer interactions before they make that purchase.
Metrics Details
By NestAds
Metrics by NestAds (metrics with logo) are collected by NestAds pixel and are outlined in the table below.
| Metrics name | Descriptions |
| Revenue | NestAds pixel’s reported Revenue. Total amount of money generated from orders attributed to specific sources. |
| ROAS | NestAds pixel’s reported Return on ad spend. Calculated as Revenue/Total ad spend. |
| CPA | NestAds pixel’s reported Cost Per Acquisition. Calculated as: Total Ad spend/Conversions or Install. |
| Visitors | NestAds pixel’s reported Visitors. Unique visitors who clicked on your ad and landed on your website. |
| Conversions | NestAds pixel’s reported Conversions. Total orders are generated from specific sources. |
| CVR | NestAds pixel’s reported Conversions Rate. Calculated as NestAds pixel’s reported conversions/channel’s reported impressions. |
| AOV | NestAds pixel’s reported Average Order Value. The average amount of money customers spend per transaction. |
| New customers | The number of customers who purchase from your business for the first time. |
| %NC | The percentage of new customers. Calculated as the number of new customers/ total customers in a defined time range. |
| CPA (NC) | New Customer Cost Per Acquisition. Calculated as total Ad Spend/ Number of New Customers. |
| Revenue (NC) | The total amount of money gained from new customers’ 1st orders. |
By channels
Metrics by channels are collected by ad platforms and are outlined in the table below.
| Metrics | Descriptions |
| Total ad spend | Channel’s reported Total ad Spend |
| Revenue | Channel’s reported Revenue |
| ROAS | Channel’s reported Return on ad spend. Calculated as Revenue/Total ad spend. |
| CPA | Channel’s reported Cost Per Acquisition. Calculated as Total Ad spend/Conversions or Install. |
| Impressions | Channel’s reported Impressions |
| Clicks | Channel’s reported Clicks |
| Conversions | Channel’s reported Conversions |
| CVR | Channel’s reported Conversions Rate. Calculated as Conversions/Impressions. |
| CTR | Channel’s reported Click Through Rate (All Clicks) |
| CPC | Channel’s reported Cost per Click |
| CPM | Channel’s reported Cost Per Mille (cost per 1000 impressions) |
Need any help?
Feel free to contact us via in-app live chat or email at [email protected]. Our support team is happy to help.