 NestAffiliate
  NestDesk
  NestScale Product Variants
 NestWidget analytics gives you a bird’s eye view of your widget performance
In this post, you will learn about NestWidget analytics and how they work. Let’s get started now!
What are NestWidget analytics?
NestWidget analytics shows the performance of all and specific widgets by time range. You can have a snapshot of which social posts and tagged products get the most engagement.
It includes 3 main sections:
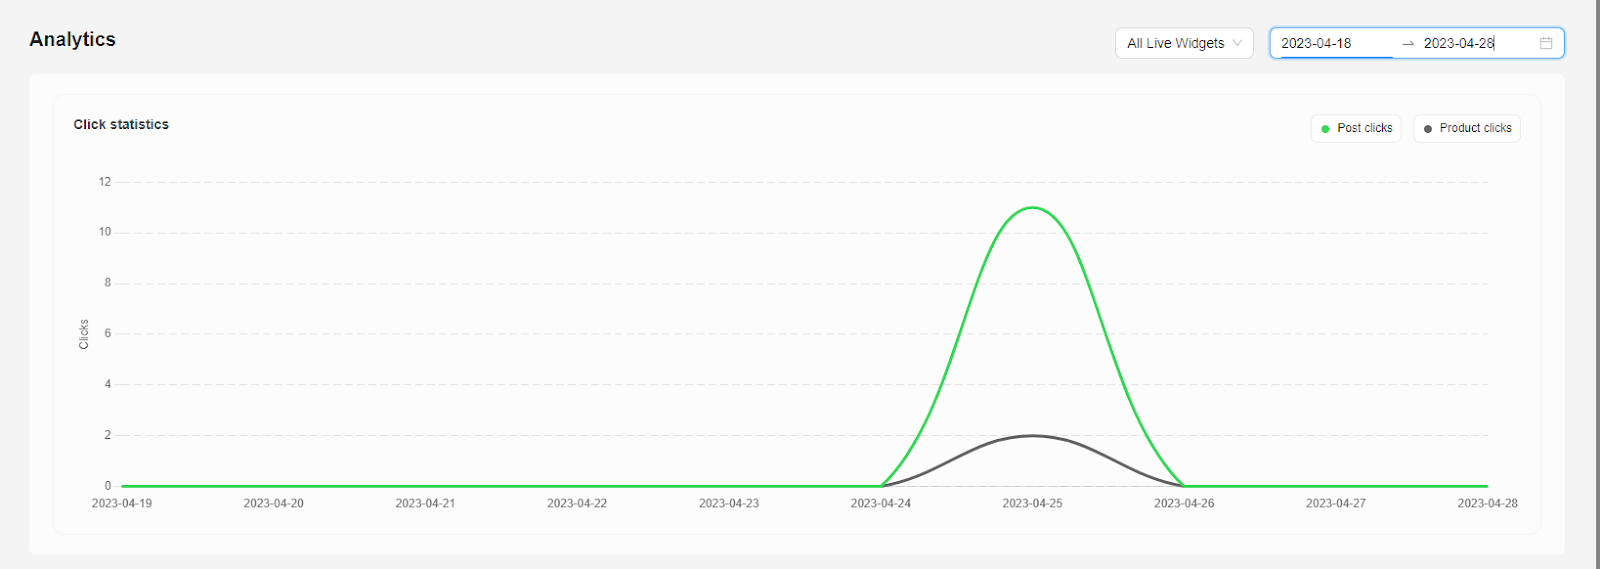
- Click statistics
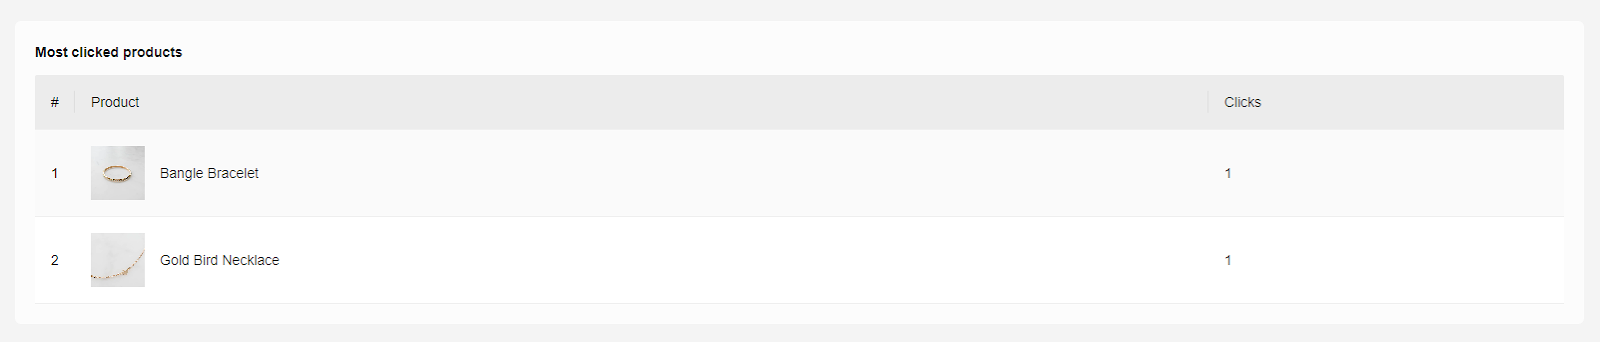
- Most clicked products
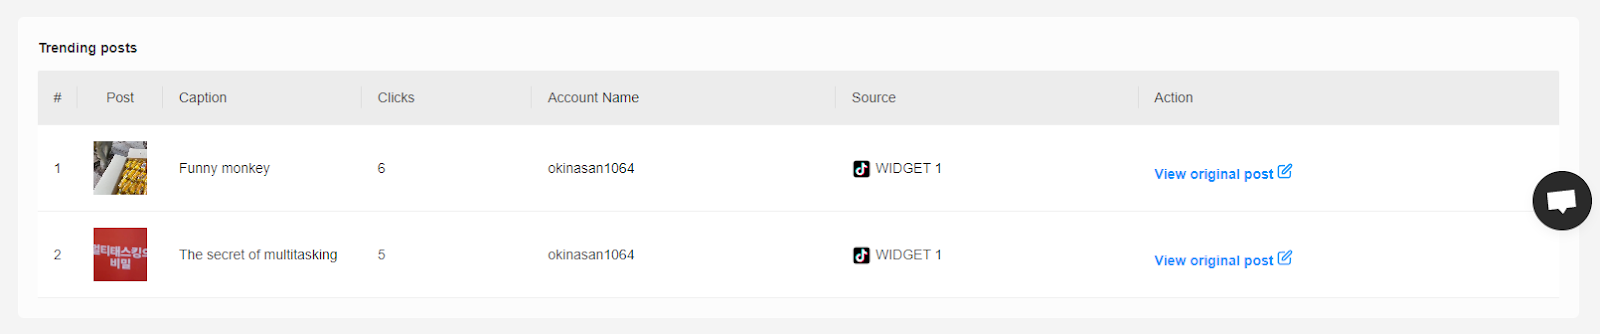
- Trending posts
How NestWidget analytics work
- Click Statistics
Click Statistics is a line chart that shows the fluctuations and correlations between Post clicks and Product clicks. You can sort data in a custom time range and filter by specific widget.
- Most clicked products
Most clicked products table shows the list of products from highest to lowest number of clicks. In particular, it counts the number of clicks on Add product button.
You can sort data in a custom time range and filter by specific widget.
- Trending posts
Trending posts table shows the list of products from highest to lowest number of clicks.
This table includes the following attributes: Posts, Caption, Account Name, Source, and Action.
You can sort data in a custom time range and filter by specific widget.
Need any help?
Please contact our support team via live chat or email at [email protected]
We are happy to help you as soon as possible!
Need any help?
Please contact our support team via live chat or email at [email protected]
We are happy to help you as soon as possible!