 NestAffiliate
  NestDesk
  NestScale Product Variants
 Analytics is the place where you can view, track & measure the performance of all bundles in the NestScale Bundles & Discounts app.
In this article, you will learn how NestScale Bundles & Discounts Analytics work. Let’s get started now!
How do NS Bundle analytics work?
NS Bundle analytics include 2 main sections:
- Performance statistics
- Best-selling bundles
📌 Please note that the analytics is showing the data collected all the time. You can change the time range as you want to view data accordingly.
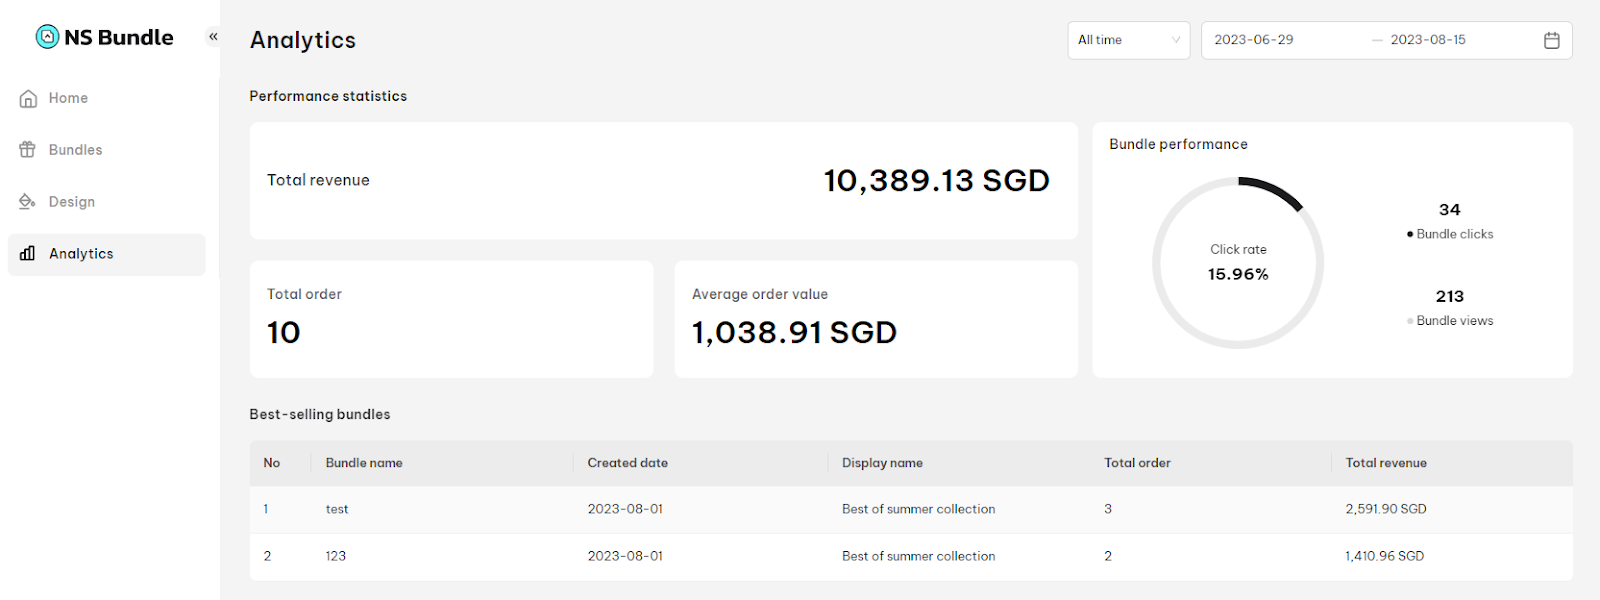
Performance statistics
This section showcase some importance metrics about your bundle performance, as shown below:
- Total revenue: This is the revenue from total bundles
- Total order: This is the number of order that has at least a bundle is included
- Average order value: This metric equals to total revenue over total order
- Bundle performance: This part showcases 3 metrics
- Bundle clicks: The total clicks of all bundles
- Bundle views: The total views of all bundles
- Click rate: This is the ratio of bundle clicks over bundle views
Best-selling bundles
This section gives you a closer look at which bundles have good performances. This list displays top bundles’ information.
- Bundle name
- Created date
- Display name
- Total order: Total order which includes that bundle
- Total revenue: Total revenue generated from that bundle
Need any help?
If you need any assistance with NestScale Bundles & Discounts app, feel free to contact us via live chat in-app or email [email protected]. Our support team is happy to help